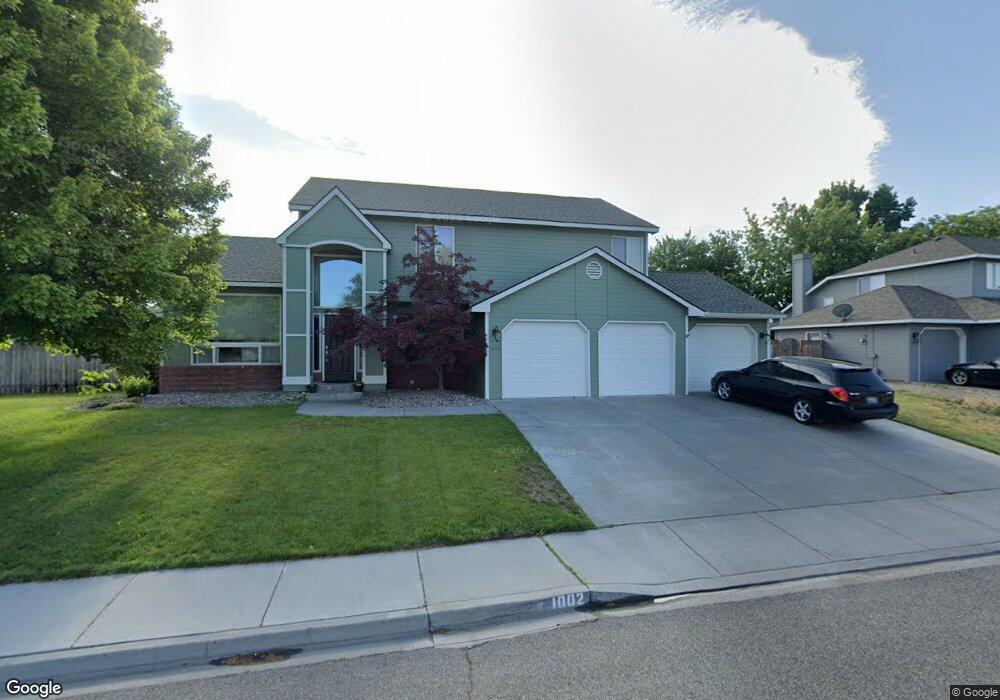
1002 N Pittsburg St Unit Beautifully Maintain Kennewick, WA 99336
Estimated Value: $459,535 - $521,000
3
Beds
3
Baths
1,910
Sq Ft
$259/Sq Ft
Est. Value
About This Home
This home is located at 1002 N Pittsburg St Unit Beautifully Maintain, Kennewick, WA 99336 and is currently estimated at $494,384, approximately $258 per square foot. 1002 N Pittsburg St Unit Beautifully Maintain is a home located in Benton County with nearby schools including Sunset View Elementary School, Desert Hills Middle School, and Kamiakin High School.
Ownership History
Date
Name
Owned For
Owner Type
Purchase Details
Closed on
Aug 15, 2017
Sold by
Rhodes Ethan D and Rhodes Jessica L
Bought by
Gallegos Jose B and Gallegos Lynnette M
Current Estimated Value
Home Financials for this Owner
Home Financials are based on the most recent Mortgage that was taken out on this home.
Original Mortgage
$255,207
Outstanding Balance
$214,595
Interest Rate
4.25%
Mortgage Type
FHA
Estimated Equity
$279,789
Purchase Details
Closed on
May 7, 2015
Sold by
Copland Stacy and Stewart Stacy
Bought by
Rhodes Ethan D and Rhodes Jessica L
Home Financials for this Owner
Home Financials are based on the most recent Mortgage that was taken out on this home.
Original Mortgage
$208,905
Interest Rate
3.64%
Mortgage Type
New Conventional
Create a Home Valuation Report for This Property
The Home Valuation Report is an in-depth analysis detailing your home's value as well as a comparison with similar homes in the area
Home Values in the Area
Average Home Value in this Area
Purchase History
| Date | Buyer | Sale Price | Title Company |
|---|---|---|---|
| Gallegos Jose B | $309,440 | Ticor Title Company | |
| Rhodes Ethan D | $219,619 | Tri City Title & Escrow |
Source: Public Records
Mortgage History
| Date | Status | Borrower | Loan Amount |
|---|---|---|---|
| Open | Gallegos Jose B | $255,207 | |
| Previous Owner | Rhodes Ethan D | $208,905 |
Source: Public Records
Tax History Compared to Growth
Tax History
| Year | Tax Paid | Tax Assessment Tax Assessment Total Assessment is a certain percentage of the fair market value that is determined by local assessors to be the total taxable value of land and additions on the property. | Land | Improvement |
|---|---|---|---|---|
| 2024 | $3,135 | $412,610 | $70,000 | $342,610 |
| 2023 | $3,135 | $391,840 | $70,000 | $321,840 |
| 2022 | $2,819 | $319,170 | $70,000 | $249,170 |
| 2021 | $2,696 | $288,020 | $70,000 | $218,020 |
| 2020 | $2,735 | $267,060 | $42,000 | $225,060 |
| 2019 | $2,042 | $259,290 | $42,000 | $217,290 |
| 2018 | $2,489 | $197,210 | $42,000 | $155,210 |
| 2017 | $2,281 | $197,210 | $42,000 | $155,210 |
| 2016 | $2,319 | $197,210 | $42,000 | $155,210 |
| 2015 | $2,466 | $197,210 | $42,000 | $155,210 |
| 2014 | -- | $208,170 | $37,000 | $171,170 |
| 2013 | -- | $208,170 | $37,000 | $171,170 |
Source: Public Records
Map
Nearby Homes
- 905 N Pittsburg St
- 2404 Mark Ave
- 8820 W Imnaha Ct
- 9005 W John Day Ave
- 8906 W Rio Grande Ave
- 2307 Franz Ct
- 9014 W Grand Ronde Ave
- 630 Meadows Dr E
- 708 N Nevada Ct
- 8608 W Imnaha Ave
- 8901 W Hood Ave
- 1302 N Montana St
- 8704 W Hood Ave
- 604 Linda Ct
- 2441 Tiger Ln
- 8712 W Entiat Ave
- 2449 Woods Dr
- 608 Meadows Dr S
- 2029 Weiskopf Ct
- 8415 W Entiat Place
- 1002 N Pittsburg St Unit Can't Take my Eyes o
- 1002 N Pittsburg St
- 1006 N Pittsburg St
- 910 N Pittsburg St
- 1015 N Oklahoma St
- 1043 N Oklahoma St
- 987 N Oklahoma St
- 1001 N Pittsburgh St
- 1001 N Pittsburg St
- 1005 N Pittsburg St
- 1071 N Oklahoma St
- 1071 N Oklahoma St Unit Quality Built Homes
- 1102 N Pittsburg St
- 909 N Pittsburg St
- 959 N Oklahoma St
- 906 N Pittsburg St
- 1009 N Pittsburg St
- 931 N Oklahoma St
- 931 N Oklahoma St Unit 4 Beds + Den + Bonus
- 1099 N Oklahoma St