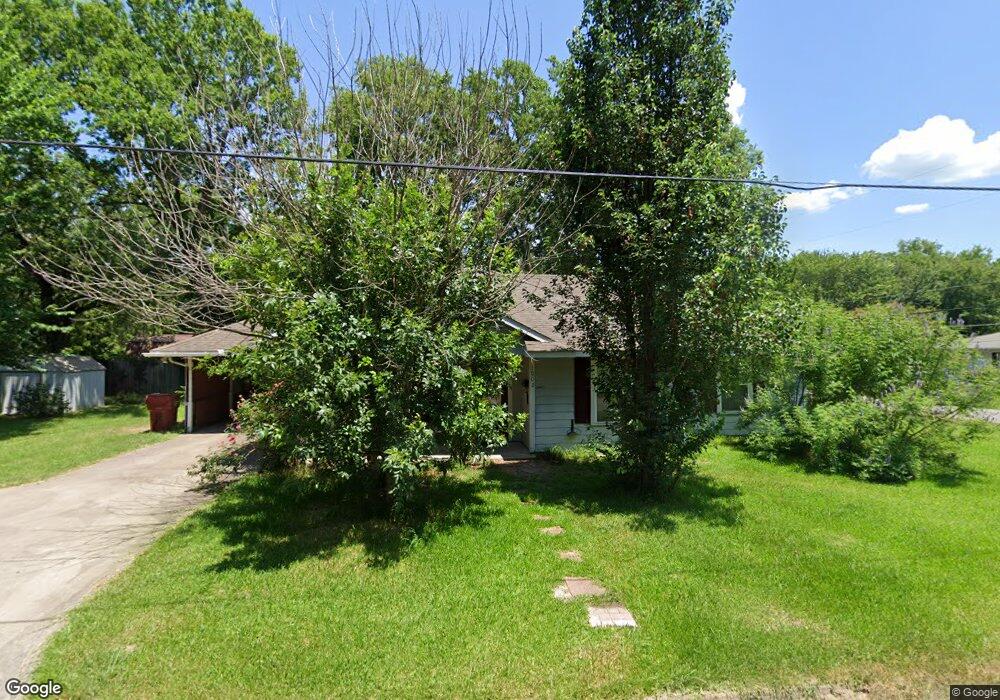
1002 Pine St Bonham, TX 75418
Estimated Value: $202,000 - $218,703
3
Beds
2
Baths
1,339
Sq Ft
$159/Sq Ft
Est. Value
About This Home
This home is located at 1002 Pine St, Bonham, TX 75418 and is currently estimated at $212,676, approximately $158 per square foot. 1002 Pine St is a home located in Fannin County with nearby schools including Evans Elementary School, Finley-Oates Elementary School, and LH Rather Jr High School.
Ownership History
Date
Name
Owned For
Owner Type
Purchase Details
Closed on
Jul 2, 2012
Sold by
The Secretary Of Hud Of Washington Dc
Bought by
Brooks Ronald D and Brooks Joyce
Current Estimated Value
Home Financials for this Owner
Home Financials are based on the most recent Mortgage that was taken out on this home.
Original Mortgage
$60,947
Outstanding Balance
$42,009
Interest Rate
3.79%
Mortgage Type
VA
Estimated Equity
$170,667
Purchase Details
Closed on
Mar 6, 2012
Sold by
Johnson Michael B and Johnson Jerri L
Bought by
Wells Fargo Bank Na
Create a Home Valuation Report for This Property
The Home Valuation Report is an in-depth analysis detailing your home's value as well as a comparison with similar homes in the area
Purchase History
| Date | Buyer | Sale Price | Title Company |
|---|---|---|---|
| Brooks Ronald D | -- | None Available | |
| Wells Fargo Bank Na | $76,035 | None Available |
Source: Public Records
Mortgage History
| Date | Status | Borrower | Loan Amount |
|---|---|---|---|
| Open | Brooks Ronald D | $60,947 |
Source: Public Records
Tax History
| Year | Tax Paid | Tax Assessment Tax Assessment Total Assessment is a certain percentage of the fair market value that is determined by local assessors to be the total taxable value of land and additions on the property. | Land | Improvement |
|---|---|---|---|---|
| 2025 | $3,196 | $207,900 | $42,070 | $165,830 |
| 2024 | $1,021 | $195,280 | $40,090 | $155,190 |
| 2023 | $2,685 | $192,320 | $38,020 | $154,300 |
| 2022 | $2,723 | $176,890 | $26,660 | $150,230 |
| 2021 | $2,844 | $139,540 | $12,940 | $126,600 |
| 2020 | $2,615 | $128,600 | $9,970 | $118,630 |
| 2019 | $2,472 | $130,360 | $9,780 | $120,580 |
| 2018 | $2,244 | $100,780 | $9,680 | $91,100 |
| 2017 | $1,965 | $81,550 | $4,540 | $77,010 |
| 2016 | $1,786 | $69,880 | $4,540 | $65,340 |
| 2015 | -- | $64,750 | $4,350 | $60,400 |
| 2014 | -- | $62,950 | $3,530 | $59,420 |
Source: Public Records
Map
Nearby Homes
Your Personal Tour Guide
Ask me questions while you tour the home.