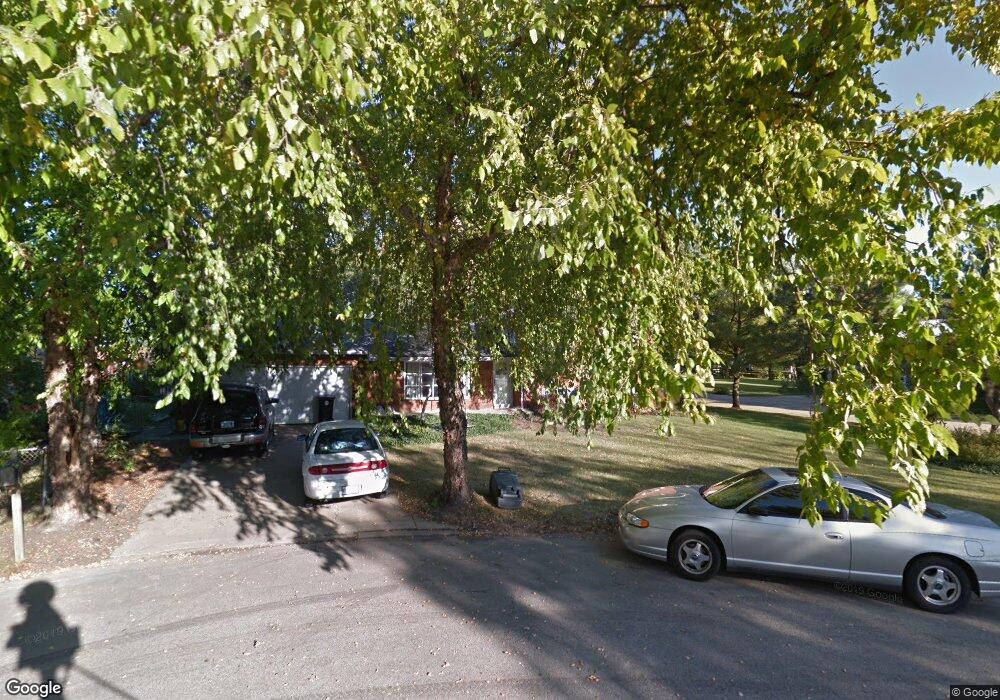
1002 Pinecrest Ct Rantoul, IL 61866
Estimated Value: $116,000 - $204,000
4
Beds
2
Baths
1,950
Sq Ft
$89/Sq Ft
Est. Value
About This Home
This home is located at 1002 Pinecrest Ct, Rantoul, IL 61866 and is currently estimated at $173,756, approximately $89 per square foot. 1002 Pinecrest Ct is a home located in Champaign County with nearby schools including Northview Elementary School, J.W. Eater Junior High School, and Rantoul Township High School.
Ownership History
Date
Name
Owned For
Owner Type
Purchase Details
Closed on
Jul 28, 2011
Sold by
Kelly Michael J and Kelly Karen S
Bought by
Kelly Grant M and Kelly Samantha A
Current Estimated Value
Home Financials for this Owner
Home Financials are based on the most recent Mortgage that was taken out on this home.
Original Mortgage
$123,108
Outstanding Balance
$85,079
Interest Rate
4.53%
Mortgage Type
New Conventional
Estimated Equity
$88,677
Purchase Details
Closed on
Feb 1, 2010
Sold by
Federal Home Loan Mortgage Corporation
Bought by
Kelly Michael J and Kelly Karen S
Purchase Details
Closed on
Jun 17, 2009
Sold by
Cotman Margo M
Bought by
Federal Home Loan Mortgage Corp
Purchase Details
Closed on
Oct 13, 2007
Sold by
Cotman Margo M
Bought by
Cotman Margo M and Cotman Thomas
Create a Home Valuation Report for This Property
The Home Valuation Report is an in-depth analysis detailing your home's value as well as a comparison with similar homes in the area
Home Values in the Area
Average Home Value in this Area
Purchase History
| Date | Buyer | Sale Price | Title Company |
|---|---|---|---|
| Kelly Grant M | $117,000 | None Available | |
| Kelly Michael J | $56,000 | Atgf Inc | |
| Federal Home Loan Mortgage Corp | -- | None Available | |
| Cotman Margo M | -- | None Available |
Source: Public Records
Mortgage History
| Date | Status | Borrower | Loan Amount |
|---|---|---|---|
| Open | Kelly Grant M | $123,108 |
Source: Public Records
Tax History
| Year | Tax Paid | Tax Assessment Tax Assessment Total Assessment is a certain percentage of the fair market value that is determined by local assessors to be the total taxable value of land and additions on the property. | Land | Improvement |
|---|---|---|---|---|
| 2024 | $1,678 | $25,220 | $8,520 | $16,700 |
| 2023 | $1,678 | $22,500 | $7,600 | $14,900 |
| 2022 | $1,503 | $20,090 | $6,790 | $13,300 |
| 2021 | $1,396 | $18,760 | $6,340 | $12,420 |
| 2020 | $1,274 | $18,130 | $6,130 | $12,000 |
| 2019 | $1,200 | $17,420 | $5,890 | $11,530 |
Source: Public Records
Map
Nearby Homes
- 920 North Dr
- 1014 Illinois Dr
- 821 Park Dr
- 1024 Eastview Dr
- 1037 Bel Aire Dr
- 804 Juniper Dr
- 1116 Bel Aire Dr
- 1205 Wedgewood Dr
- 325 E Campbell Ave
- 106 N Chanute St
- 209 E Belle Ave
- 932 E Sangamon Ave
- 409 E Congress Ave
- 405 Neipswah Ave
- 409 Neipswah Ave
- 510 Parker Place
- 626 W Champaign Ave
- 1638 E Grove Ave
- 1644 E Grove Ave
- 1468 Mather Dr
- 915 Pinecrest Dr
- 914 Illinois Ct
- 921 Pinecrest Dr
- 908 Pinecrest Dr
- 827 Pinecrest Dr
- 1012 Pinecrest Ct
- 902 Pinecrest Dr
- 914 Pinecrest Dr
- 1007 Pinecrest Ct
- 832 Pinecrest Dr
- 907 Illinois Ct
- 920 Pinecrest Dr
- 929 Pinecrest Dr
- 823 Pinecrest Dr
- 926 Illinois Ct
- 826 Pinecrest Dr
- 1032 Ruth Crane Dr
- 1026 Ruth Crane Dr
- 831 Morningside Dr
Your Personal Tour Guide
Ask me questions while you tour the home.