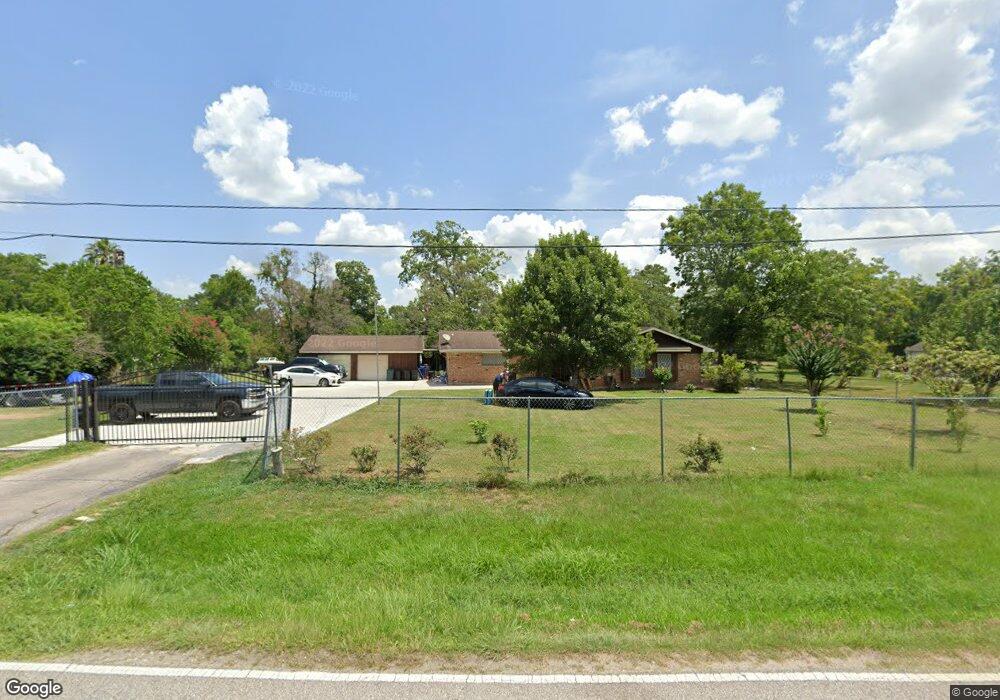
1002 Red Bud St Channelview, TX 77530
Estimated Value: $234,000 - $334,000
3
Beds
2
Baths
1,725
Sq Ft
$153/Sq Ft
Est. Value
About This Home
This home is located at 1002 Red Bud St, Channelview, TX 77530 and is currently estimated at $264,312, approximately $153 per square foot. 1002 Red Bud St is a home located in Harris County with nearby schools including Channelview High School and San Jacinto Christian Academy.
Ownership History
Date
Name
Owned For
Owner Type
Purchase Details
Closed on
Nov 27, 2013
Sold by
Ayers Edward and Ayers Jo Anne
Bought by
Campos Antonio G and Campos Sandra
Current Estimated Value
Home Financials for this Owner
Home Financials are based on the most recent Mortgage that was taken out on this home.
Original Mortgage
$127,645
Outstanding Balance
$95,556
Interest Rate
4.25%
Mortgage Type
FHA
Estimated Equity
$168,756
Purchase Details
Closed on
May 15, 1997
Sold by
Buchta Donald E and Buchta Barbara G
Bought by
Ayers Edward and Ayers Anne
Home Financials for this Owner
Home Financials are based on the most recent Mortgage that was taken out on this home.
Original Mortgage
$61,500
Interest Rate
8.16%
Purchase Details
Closed on
May 3, 1994
Sold by
Rippy Vernon D
Bought by
Buchta Donald Ed and Buchta Barbara G
Create a Home Valuation Report for This Property
The Home Valuation Report is an in-depth analysis detailing your home's value as well as a comparison with similar homes in the area
Home Values in the Area
Average Home Value in this Area
Purchase History
| Date | Buyer | Sale Price | Title Company |
|---|---|---|---|
| Campos Antonio G | -- | None Available | |
| Ayers Edward | -- | American Title Company | |
| Buchta Donald Ed | -- | -- | |
| Buchta Donald Ed | -- | -- |
Source: Public Records
Mortgage History
| Date | Status | Borrower | Loan Amount |
|---|---|---|---|
| Open | Campos Antonio G | $127,645 | |
| Previous Owner | Ayers Edward | $61,500 | |
| Closed | Ayers Edward | $12,300 |
Source: Public Records
Tax History Compared to Growth
Tax History
| Year | Tax Paid | Tax Assessment Tax Assessment Total Assessment is a certain percentage of the fair market value that is determined by local assessors to be the total taxable value of land and additions on the property. | Land | Improvement |
|---|---|---|---|---|
| 2025 | $2,683 | $222,612 | $97,498 | $125,114 |
| 2024 | $2,683 | $197,227 | $85,311 | $111,916 |
| 2023 | $2,683 | $213,029 | $85,311 | $127,718 |
| 2022 | $3,891 | $183,239 | $73,124 | $110,115 |
| 2021 | $3,683 | $181,758 | $48,749 | $133,009 |
| 2020 | $3,548 | $150,356 | $43,874 | $106,482 |
| 2019 | $3,299 | $140,819 | $43,874 | $96,945 |
| 2018 | $1,245 | $130,305 | $24,375 | $105,930 |
| 2017 | $2,730 | $130,305 | $24,375 | $105,930 |
| 2016 | $2,481 | $113,593 | $18,281 | $95,312 |
| 2015 | $1,768 | $113,593 | $18,281 | $95,312 |
| 2014 | $1,768 | $78,000 | $18,281 | $59,719 |
Source: Public Records
Map
Nearby Homes
- 16134 Palm St
- 1211 Pecan St
- 1109 Becker St
- 0 Laurelwood Dr Unit 43034610
- 16326 Bear Bayou Dr
- 16219 Bear Bayou 1 2 Dr
- 16121 Bear Bayou Dr Unit 13
- 16023 Ridlon St
- 16032 1/2 Ridlon St
- 16600 Laurelwood Dr
- 00 Laurelwood Dr
- 16736 Forest Trail Dr
- 16811 Forest Trail Dr
- 16931 Avenue B
- 16809 Market St
- 108 Cedar Ln
- 17119 Water Oak Dr
- 822 Woodhue St
- 16534 Market St
- 16516 Market St
- 1006 Red Bud St
- 924 Red Bud St
- 16230 Scales St
- 918 Red Bud St
- 1008 Red Bud St
- 1010 Red Bud St
- 919 Red Bud St
- 16226 Scales St
- 1001 Red Bud St
- 914 Red Bud St
- 16222 Scales St
- 1003 Red Bud St
- 915 Red Bud St
- 1010 Meads St
- 1005 Red Bud St
- 923 Red Bud St
- 1018 Meads St
- 1014 Red Bud St
- 1007 Red Bud St
- 1022 Meads St