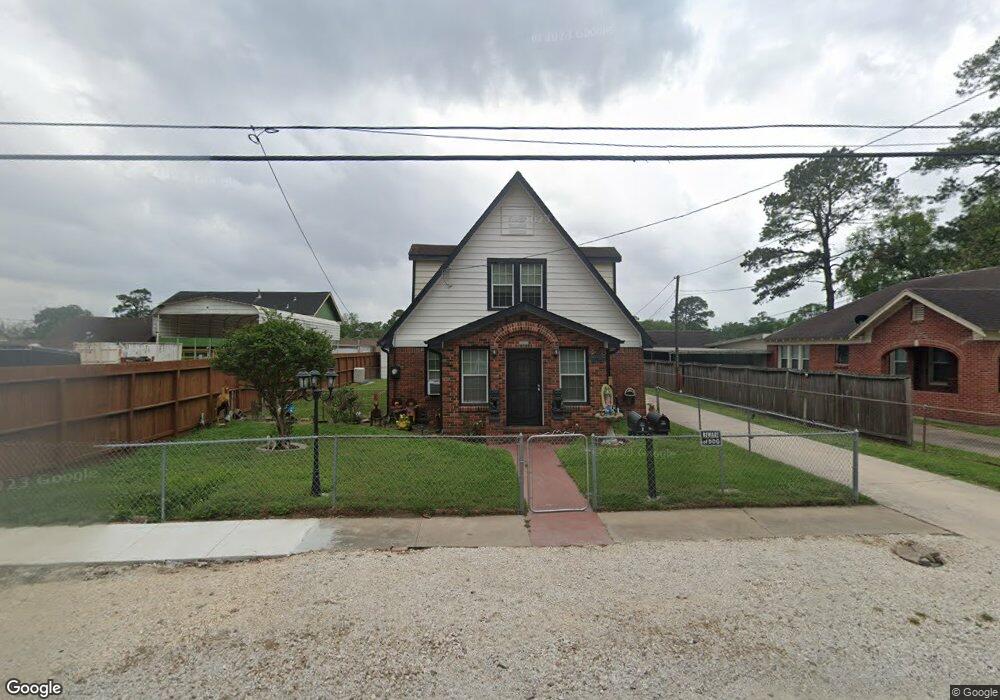
1002 Reid St Houston, TX 77022
Northside-Northline NeighborhoodEstimated Value: $290,949 - $403,000
4
Beds
3
Baths
2,665
Sq Ft
$135/Sq Ft
Est. Value
About This Home
This home is located at 1002 Reid St, Houston, TX 77022 and is currently estimated at $359,487, approximately $134 per square foot. 1002 Reid St is a home located in Harris County with nearby schools including Roosevelt Elementary School, Burbank Middle School, and Northside High School.
Ownership History
Date
Name
Owned For
Owner Type
Purchase Details
Closed on
Nov 8, 2006
Sold by
Rios Carlos and Rios Janie
Bought by
Rios Eyvonne and Rios Armando
Current Estimated Value
Purchase Details
Closed on
Jul 14, 1998
Sold by
Long Avis Jeannine Bonjour and Foster Elizabeth Georgeine Bonjour
Bought by
Rios Carlos O and Rios Juanita C
Home Financials for this Owner
Home Financials are based on the most recent Mortgage that was taken out on this home.
Original Mortgage
$77,850
Interest Rate
11%
Create a Home Valuation Report for This Property
The Home Valuation Report is an in-depth analysis detailing your home's value as well as a comparison with similar homes in the area
Home Values in the Area
Average Home Value in this Area
Purchase History
| Date | Buyer | Sale Price | Title Company |
|---|---|---|---|
| Rios Eyvonne | -- | None Available | |
| Rios Carlos O | -- | Commonwealth Land Title Co |
Source: Public Records
Mortgage History
| Date | Status | Borrower | Loan Amount |
|---|---|---|---|
| Previous Owner | Rios Carlos O | $77,850 | |
| Closed | Rios Carlos O | $4,325 |
Source: Public Records
Tax History Compared to Growth
Tax History
| Year | Tax Paid | Tax Assessment Tax Assessment Total Assessment is a certain percentage of the fair market value that is determined by local assessors to be the total taxable value of land and additions on the property. | Land | Improvement |
|---|---|---|---|---|
| 2025 | $61 | $270,951 | $113,580 | $157,371 |
| 2024 | $61 | $284,300 | $58,300 | $226,000 |
| 2023 | $61 | $284,300 | $58,300 | $226,000 |
| 2022 | $4,345 | $224,927 | $58,300 | $166,627 |
| 2021 | $4,181 | $179,391 | $58,300 | $121,091 |
| 2020 | $4,201 | $179,391 | $58,300 | $121,091 |
| 2019 | $3,990 | $179,391 | $58,300 | $121,091 |
| 2018 | $607 | $143,357 | $58,300 | $85,057 |
| 2017 | $3,406 | $143,357 | $58,300 | $85,057 |
| 2016 | $3,096 | $143,357 | $58,300 | $85,057 |
| 2015 | $617 | $118,776 | $30,608 | $88,168 |
| 2014 | $617 | $101,204 | $30,608 | $70,596 |
Source: Public Records
Map
Nearby Homes