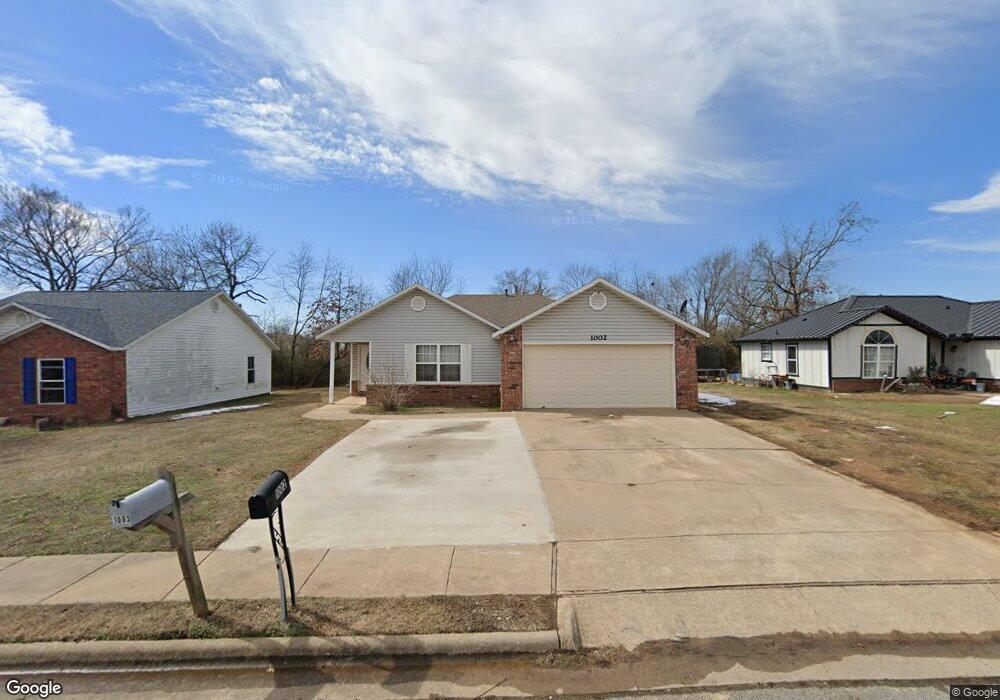
1002 S D St Rogers, AR 72756
Estimated Value: $257,000 - $286,605
3
Beds
2
Baths
1,080
Sq Ft
$250/Sq Ft
Est. Value
About This Home
This home is located at 1002 S D St, Rogers, AR 72756 and is currently estimated at $270,151, approximately $250 per square foot. 1002 S D St is a home located in Benton County with nearby schools including Eastside Elementary School, Lingle Middle School, and Rogers Heritage High School.
Ownership History
Date
Name
Owned For
Owner Type
Purchase Details
Closed on
May 12, 2021
Sold by
Perez Martin and Perez Maria Luz
Bought by
Perez Efrain
Current Estimated Value
Home Financials for this Owner
Home Financials are based on the most recent Mortgage that was taken out on this home.
Original Mortgage
$49,094
Outstanding Balance
$36,923
Interest Rate
3.1%
Mortgage Type
FHA
Estimated Equity
$233,228
Purchase Details
Closed on
Oct 30, 2002
Bought by
Perez
Create a Home Valuation Report for This Property
The Home Valuation Report is an in-depth analysis detailing your home's value as well as a comparison with similar homes in the area
Home Values in the Area
Average Home Value in this Area
Purchase History
We collect this data history from publicly available records. To have your information removed, we recommend requesting removal directly through your county’s website.
| Date | Buyer | Sale Price | Title Company |
|---|---|---|---|
| Perez Efrain | $50,000 | None Listed On Document | |
| Perez | $84,000 | -- |
Source: Public Records
Mortgage History
We collect this data history from publicly available records. To have your information removed, we recommend requesting removal directly through your county’s website.
| Date | Status | Borrower | Loan Amount |
|---|---|---|---|
| Open | Perez Efrain | $49,094 |
Source: Public Records
Tax History
| Year | Tax Paid | Tax Assessment Tax Assessment Total Assessment is a certain percentage of the fair market value that is determined by local assessors to be the total taxable value of land and additions on the property. | Land | Improvement |
|---|---|---|---|---|
| 2025 | $2,207 | $53,121 | $19,000 | $34,121 |
| 2024 | $1,974 | $53,121 | $19,000 | $34,121 |
| 2023 | $1,794 | $33,920 | $8,000 | $25,920 |
| 2022 | $1,866 | $33,920 | $8,000 | $25,920 |
| 2021 | $1,344 | $33,920 | $8,000 | $25,920 |
| 2020 | $1,222 | $22,260 | $2,400 | $19,860 |
| 2019 | $1,222 | $22,260 | $2,400 | $19,860 |
| 2018 | $1,222 | $22,260 | $2,400 | $19,860 |
| 2017 | $1,121 | $22,260 | $2,400 | $19,860 |
| 2016 | $1,121 | $22,260 | $2,400 | $19,860 |
| 2015 | $1,038 | $19,630 | $3,600 | $16,030 |
| 2014 | $1,038 | $19,630 | $3,600 | $16,030 |
Source: Public Records
Map
Nearby Homes
- 429 E Mulberry St
- 121 E Veterans Pkwy
- 1013 S 1st St
- Lot N/2 Blk 6-10/1 Roberts & Musteen Add
- 702 E Sumac St
- 803 S 1st St
- 1203 S 3rd St
- 1434 S Monte Northeast Rd
- 217 W Birch St
- 1530 Monte Ne Rd
- 1706 S F St
- 1219 S 5th St
- 1016 S 4th St
- Lot 7 S 3rd St
- Lot 5 S 3rd St
- Lot 6 S 3rd St
- 1810 S H St
- 1811 S H St
- 1.47 Acres E Allen St
- 818 E Kiwi St
Your Personal Tour Guide
Ask me questions while you tour the home.