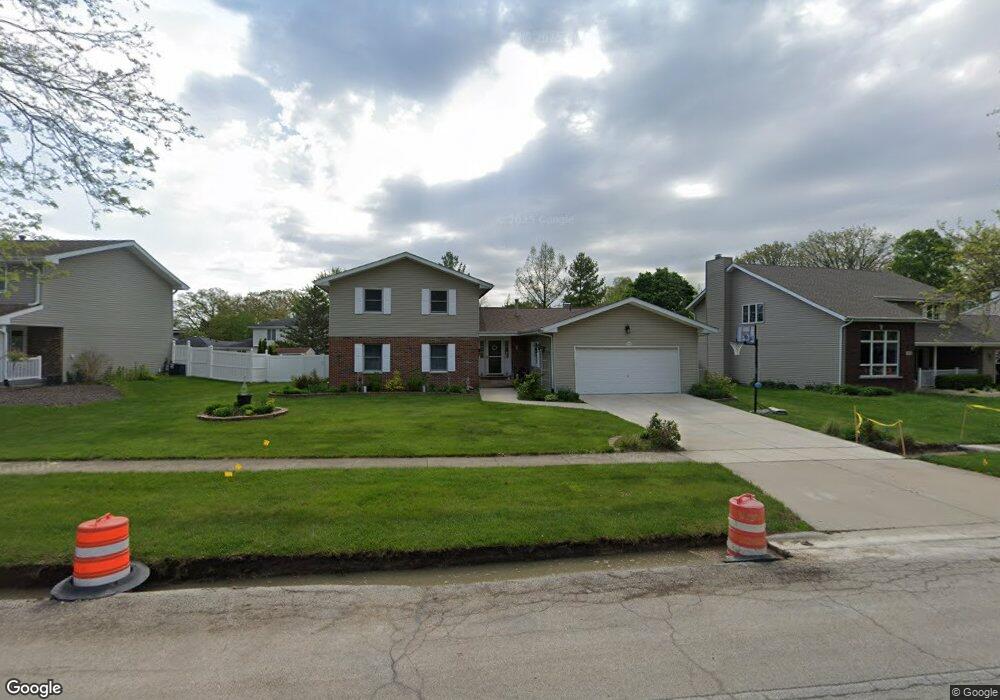
1002 S Raven Rd Shorewood, IL 60404
Estimated Value: $350,000 - $358,000
--
Bed
--
Bath
2,035
Sq Ft
$174/Sq Ft
Est. Value
About This Home
This home is located at 1002 S Raven Rd, Shorewood, IL 60404 and is currently estimated at $354,667, approximately $174 per square foot. 1002 S Raven Rd is a home located in Will County with nearby schools including Shorewood Elementary School, Troy Middle School, and Orenic Intermediate School.
Ownership History
Date
Name
Owned For
Owner Type
Purchase Details
Closed on
Oct 28, 2003
Sold by
Aleksic Danny D and Aleksic Heidi
Bought by
Neverman Daniel E and Neverman Dawn N
Current Estimated Value
Home Financials for this Owner
Home Financials are based on the most recent Mortgage that was taken out on this home.
Original Mortgage
$170,000
Outstanding Balance
$79,196
Interest Rate
6.07%
Mortgage Type
Purchase Money Mortgage
Estimated Equity
$275,471
Purchase Details
Closed on
Jun 28, 1997
Sold by
Miller Donald B and Miller Teresa K
Bought by
Kreis Jeffrey and Kreis Janeth C
Home Financials for this Owner
Home Financials are based on the most recent Mortgage that was taken out on this home.
Original Mortgage
$102,900
Interest Rate
7.37%
Purchase Details
Closed on
May 22, 1995
Sold by
Nlsb
Bought by
Miller Donald B and Miller Teresa K
Home Financials for this Owner
Home Financials are based on the most recent Mortgage that was taken out on this home.
Original Mortgage
$112,800
Interest Rate
8.4%
Create a Home Valuation Report for This Property
The Home Valuation Report is an in-depth analysis detailing your home's value as well as a comparison with similar homes in the area
Home Values in the Area
Average Home Value in this Area
Purchase History
| Date | Buyer | Sale Price | Title Company |
|---|---|---|---|
| Neverman Daniel E | $218,000 | Ticor Title | |
| Kreis Jeffrey | $138,000 | -- | |
| Miller Donald B | $141,000 | -- |
Source: Public Records
Mortgage History
| Date | Status | Borrower | Loan Amount |
|---|---|---|---|
| Open | Neverman Daniel E | $170,000 | |
| Previous Owner | Kreis Jeffrey | $102,900 | |
| Previous Owner | Miller Donald B | $112,800 |
Source: Public Records
Tax History Compared to Growth
Tax History
| Year | Tax Paid | Tax Assessment Tax Assessment Total Assessment is a certain percentage of the fair market value that is determined by local assessors to be the total taxable value of land and additions on the property. | Land | Improvement |
|---|---|---|---|---|
| 2024 | $6,368 | $90,329 | $14,599 | $75,730 |
| 2023 | $6,368 | $81,158 | $13,117 | $68,041 |
| 2022 | $5,665 | $76,796 | $12,412 | $64,384 |
| 2021 | $5,290 | $72,244 | $11,676 | $60,568 |
| 2020 | $4,848 | $66,125 | $11,676 | $54,449 |
| 2019 | $4,734 | $63,429 | $11,200 | $52,229 |
| 2018 | $4,511 | $60,029 | $11,200 | $48,829 |
| 2017 | $4,400 | $58,085 | $11,200 | $46,885 |
| 2016 | $4,310 | $55,778 | $11,200 | $44,578 |
| 2015 | $4,115 | $52,176 | $10,023 | $42,153 |
| 2014 | $4,115 | $53,343 | $10,023 | $43,320 |
| 2013 | $4,115 | $53,343 | $10,023 | $43,320 |
Source: Public Records
Map
Nearby Homes
- 1007 Windsor Dr
- 741 River Bluff Dr
- 20718 S Sarver Dr Unit 1
- 200 Shorewood Ln
- 00002 Jefferson St
- 1 AC Jefferson St
- 00001 Jefferson St
- 24614 Kaylee St
- 201 Oakwood Dr
- 2057 Isabella Ln
- 2031 Isabell Ln Unit 1
- 2037 Isabell Ln
- 2048 Isabella Ln
- 20941 Lee St
- 20948 Lakewoods Ln
- 20937 S Ron Lee Dr
- 21042 Lakewoods Ln
- 22020 S River Rd
- 21053 Benjamin Dr
- 0000 W Seil Rd
- 1002 S Raven Rd
- 1004 S Raven Rd
- 1000 S Raven Rd
- 1006 S Raven Rd
- 910 S Raven Rd
- 913 Lynwood Ct
- 1001 S Raven Rd
- 1003 S Raven Rd
- 915 Lynwood Ct
- 915 S Raven Rd
- 1005 S Raven Rd
- 913 S Raven Rd
- 1008 S Raven Rd
- 908 S Raven Rd
- 911 Lynwood Ct
- 1007 S Raven Rd
- 911 S Raven Rd
- 914 Lynwood Ct
- 1100 S Raven Rd
- 900 Windsor Dr