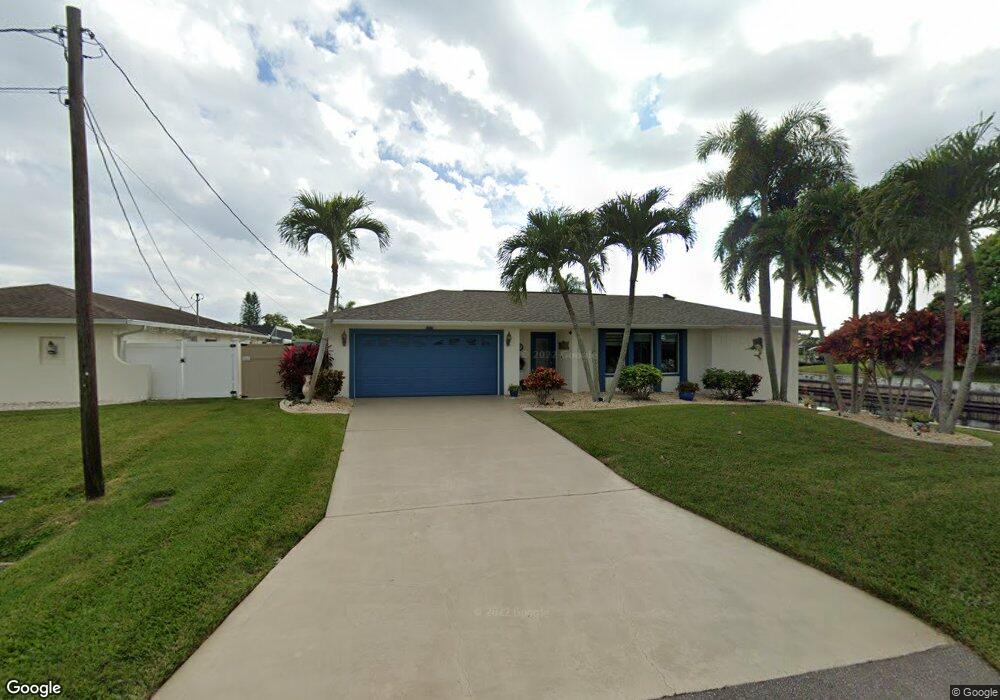
1002 SE 43rd St Cape Coral, FL 33904
Bimini Basin NeighborhoodEstimated Value: $516,634 - $1,089,000
3
Beds
2
Baths
1,965
Sq Ft
$366/Sq Ft
Est. Value
About This Home
This home is located at 1002 SE 43rd St, Cape Coral, FL 33904 and is currently estimated at $718,659, approximately $365 per square foot. 1002 SE 43rd St is a home located in Lee County with nearby schools including Cape Elementary School, Caloosa Elementary School, and Tropic Isles Elementary School.
Ownership History
Date
Name
Owned For
Owner Type
Purchase Details
Closed on
Mar 31, 2020
Sold by
Knoll Kenneth Francis and Knoll Maryann Rose
Bought by
Brainard Jack W and Burleson Drue A
Current Estimated Value
Home Financials for this Owner
Home Financials are based on the most recent Mortgage that was taken out on this home.
Original Mortgage
$440,000
Outstanding Balance
$389,787
Interest Rate
3.4%
Mortgage Type
New Conventional
Estimated Equity
$328,872
Purchase Details
Closed on
Jan 31, 2008
Sold by
South Charles E and South Sylvia A
Bought by
Knoll Kenneth Francis and Knoll Maryann Rose
Purchase Details
Closed on
Feb 28, 2003
Sold by
Barbe Glen T and Barbe Linda C
Bought by
South Charles E and South Sylvia A
Home Financials for this Owner
Home Financials are based on the most recent Mortgage that was taken out on this home.
Original Mortgage
$260,000
Interest Rate
5.88%
Purchase Details
Closed on
Jul 19, 1999
Sold by
Shively Darrell E and Shively Terrie S
Bought by
Barbe Glen T and Barbe Linda C
Home Financials for this Owner
Home Financials are based on the most recent Mortgage that was taken out on this home.
Original Mortgage
$120,000
Interest Rate
7.51%
Create a Home Valuation Report for This Property
The Home Valuation Report is an in-depth analysis detailing your home's value as well as a comparison with similar homes in the area
Home Values in the Area
Average Home Value in this Area
Purchase History
| Date | Buyer | Sale Price | Title Company |
|---|---|---|---|
| Brainard Jack W | $599,000 | Integrity Ttl & Document Svc | |
| Knoll Kenneth Francis | $357,500 | Sunbelt Title Agency | |
| South Charles E | $325,000 | -- | |
| Barbe Glen T | $164,000 | -- |
Source: Public Records
Mortgage History
| Date | Status | Borrower | Loan Amount |
|---|---|---|---|
| Open | Brainard Jack W | $440,000 | |
| Previous Owner | South Charles E | $260,000 | |
| Previous Owner | Barbe Glen T | $120,000 |
Source: Public Records
Tax History Compared to Growth
Tax History
| Year | Tax Paid | Tax Assessment Tax Assessment Total Assessment is a certain percentage of the fair market value that is determined by local assessors to be the total taxable value of land and additions on the property. | Land | Improvement |
|---|---|---|---|---|
| 2025 | $6,593 | $416,867 | -- | -- |
| 2024 | $6,418 | $405,119 | -- | -- |
| 2023 | $6,418 | $393,319 | $0 | $0 |
| 2022 | $6,106 | $381,863 | $0 | $0 |
| 2021 | $6,344 | $370,741 | $230,421 | $140,320 |
| 2020 | $5,049 | $286,587 | $0 | $0 |
| 2019 | $4,899 | $280,144 | $0 | $0 |
| 2018 | $4,900 | $274,921 | $0 | $0 |
| 2017 | $4,859 | $269,362 | $0 | $0 |
| 2016 | $4,791 | $277,096 | $185,453 | $91,643 |
| 2015 | $4,848 | $261,988 | $163,156 | $98,832 |
| 2014 | $5,192 | $273,701 | $147,539 | $126,162 |
| 2013 | -- | $280,590 | $163,255 | $117,335 |
Source: Public Records
Map
Nearby Homes
- 1005 SE 43rd Terrace
- 1025 SE 43rd Terrace
- 1010 SE 43rd Terrace
- 4407 SE 11th Place
- 913 SE 43rd Terrace
- 820 SE 43rd St
- 4405 SE 8th Place
- 4012 Country Club Blvd
- 4015 SE 9th Ct
- 4421 Coronado Pkwy
- 734 SE 43rd St
- 1237 SE 40th St
- 821 SE 41st St
- 1005 SE 40th St Unit 5
- 1005 SE 40th St Unit 4
- 726 SE 43rd Terrace
- 4419 SE 13th Place
- 1102 SE 39th Terrace Unit 108
- 714 SE 43rd St
- 1306 SE 43rd Terrace
- 1006 SE 43rd St
- 121 SE 43rd St
- 1010 SE 43rd St
- 4132 SE 10th Ave
- 928 SE 43rd St
- 4133 SE 9th Ct
- 4128 SE 10th Ave
- 922 SE 43rd St
- 1015 SE 43rd St
- 4129 SE 9th Ct
- 1020 SE 43rd St
- 4124 SE 10th Ave Unit 9
- 1009 SE 43rd Terrace
- 918 SE 43rd St
- 1013 SE 43rd Terrace
- 4125 SE 9th Ct
- 1004 SE 42nd Ln Unit 1
- 1004 SE 42nd Ln
- 4132 SE 9th Ct
- 1022 SE 43rd St