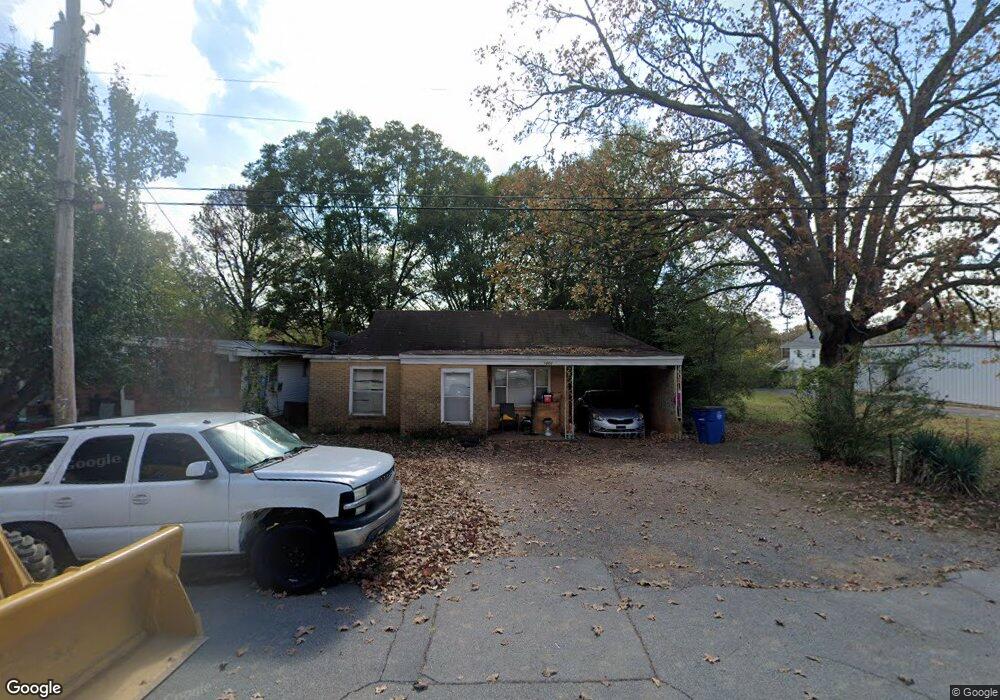
1002 W 48th St North Little Rock, AR 72118
Amboy NeighborhoodEstimated Value: $103,000 - $115,000
--
Bed
1
Bath
1,250
Sq Ft
$86/Sq Ft
Est. Value
About This Home
This home is located at 1002 W 48th St, North Little Rock, AR 72118 and is currently estimated at $107,169, approximately $85 per square foot. 1002 W 48th St is a home located in Pulaski County with nearby schools including Ridgeroad Elementary School, North Little Rock Middle School 6th Grade Campus, and North Little Rock High School.
Ownership History
Date
Name
Owned For
Owner Type
Purchase Details
Closed on
May 12, 2006
Sold by
Rummel Ernest Scott and Rummel Sylvia A
Bought by
S & S Business Enterprise Inc
Current Estimated Value
Purchase Details
Closed on
Nov 23, 2005
Sold by
Rummel Ernest Scott and Rummel Ernest
Bought by
Rummel Ernest Scott and Rummel Sylvia A
Purchase Details
Closed on
Mar 21, 2003
Sold by
Hud
Bought by
Rummel Ernest Scott
Purchase Details
Closed on
May 2, 2002
Sold by
Cendant Mortgage Corp
Bought by
Hud
Purchase Details
Closed on
Apr 23, 2002
Sold by
Maier Janet and Maier Rick
Bought by
Cendant Mtg Corp
Purchase Details
Closed on
Jun 25, 1999
Sold by
Real Estate Central Inc
Bought by
Maier Janet
Home Financials for this Owner
Home Financials are based on the most recent Mortgage that was taken out on this home.
Original Mortgage
$39,077
Interest Rate
7.63%
Mortgage Type
FHA
Create a Home Valuation Report for This Property
The Home Valuation Report is an in-depth analysis detailing your home's value as well as a comparison with similar homes in the area
Home Values in the Area
Average Home Value in this Area
Purchase History
| Date | Buyer | Sale Price | Title Company |
|---|---|---|---|
| S & S Business Enterprise Inc | -- | None Available | |
| Rummel Ernest Scott | -- | -- | |
| Rummel Ernest Scott | -- | Three Rivers Title Svcs Inc | |
| Hud | -- | -- | |
| Cendant Mtg Corp | $48,334 | -- | |
| Maier Janet | $40,000 | River City Title Company |
Source: Public Records
Mortgage History
| Date | Status | Borrower | Loan Amount |
|---|---|---|---|
| Previous Owner | Maier Janet | $39,077 |
Source: Public Records
Tax History Compared to Growth
Tax History
| Year | Tax Paid | Tax Assessment Tax Assessment Total Assessment is a certain percentage of the fair market value that is determined by local assessors to be the total taxable value of land and additions on the property. | Land | Improvement |
|---|---|---|---|---|
| 2025 | $925 | $15,083 | $2,400 | $12,683 |
| 2024 | $792 | $15,083 | $2,400 | $12,683 |
| 2023 | $792 | $15,083 | $2,400 | $12,683 |
| 2022 | $726 | $15,083 | $2,400 | $12,683 |
| 2021 | $660 | $9,880 | $760 | $9,120 |
| 2020 | $660 | $9,880 | $760 | $9,120 |
| 2019 | $660 | $9,880 | $760 | $9,120 |
| 2018 | $660 | $9,880 | $760 | $9,120 |
| 2017 | $660 | $9,880 | $760 | $9,120 |
| 2016 | $705 | $10,560 | $800 | $9,760 |
| 2015 | $705 | $10,560 | $800 | $9,760 |
| 2014 | $705 | $10,560 | $800 | $9,760 |
Source: Public Records
Map
Nearby Homes
- 1000 W 48th St
- 1000 W 48th St Unit 12
- 1001 W 47th St
- 919 W 47th St
- 1009 W 47th St Unit 12
- 1003 W 48th St
- 1005 W 48th St
- 917 W 47th St
- 1013 W 48th St
- 1011 W 47th St Unit 12
- 915 W 47th St
- 1001 W 48th St
- 1007 W 48th St
- 519 & 517 W 47th St
- 4800 Pike Ave
- 0 Pike Ave Unit 15033175
- 0 Pike Ave Unit 16004952
- 0 Pike Ave Unit 20031754
- 0 Pike Ave Unit 19001636
- 0 Pike Ave Unit 17010247