
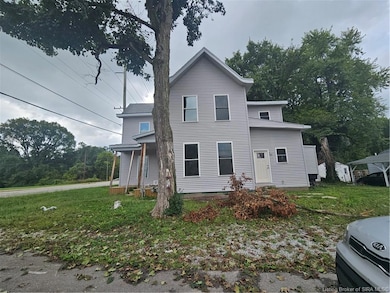
1002 W Main St New Albany, IN 47150
Estimated payment $1,187/month
About This Home
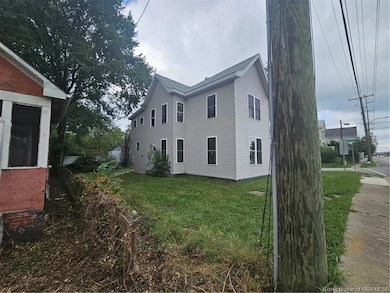
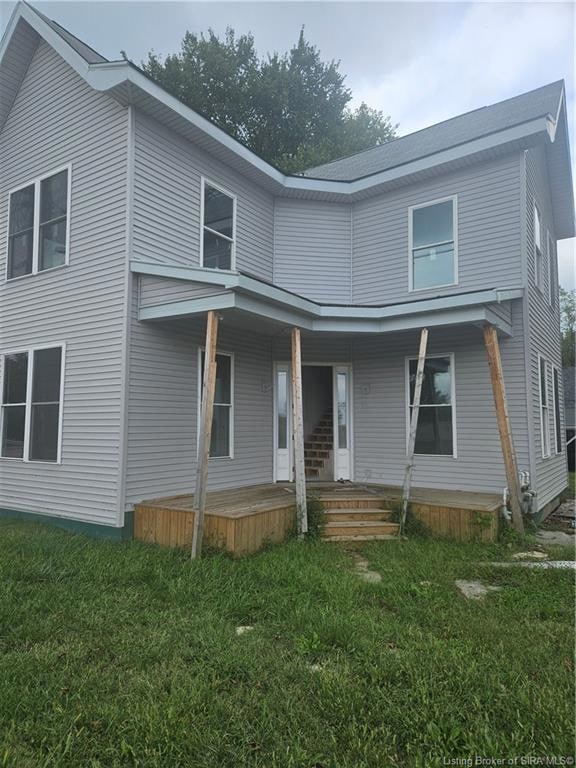
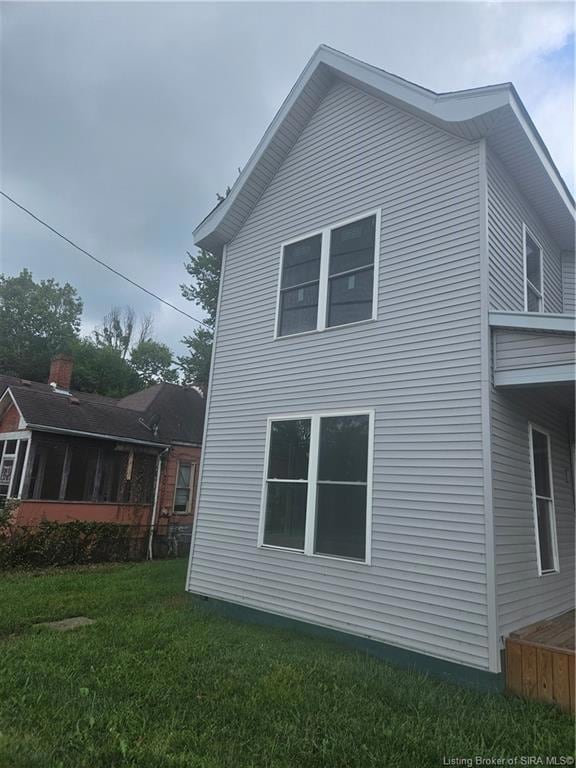
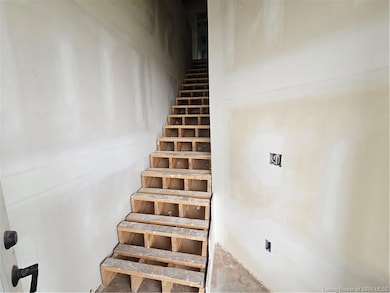
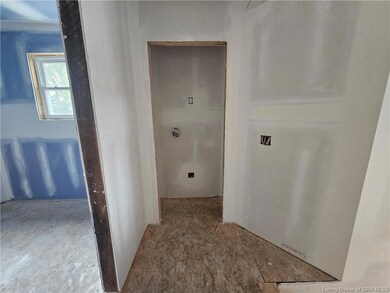
Tons of potential! This 3 unit property is ready for the new owner to finish! Bring your tools! Vinyl siding! Covered front porch! Updated windows! Framing and drywall look to be complete! The upstairs unit is 2 bedrooms and 1 full bathroom! The two ground floor units are each 1 bedroom and 1 full bathroom! Great location near Downtown New Albany and the riverfront! Call today for a private showing before this great opportunity is SOLD!
Home Details
Home Type
- Single Family
Est. Annual Taxes
- $1,599
Year Built
- Built in 1929
Lot Details
- 4,356 Sq Ft Lot
- Corner Lot
Home Design
- Frame Construction
Interior Spaces
- 2,170 Sq Ft Home
- 2-Story Property
- Basement
- Basement Cellar
Bedrooms and Bathrooms
- 4 Bedrooms
- 3 Full Bathrooms
Listing and Financial Details
- Assessor Parcel Number 0088530012
Map
Home Values in the Area
Average Home Value in this Area
Tax History
| Year | Tax Paid | Tax Assessment Tax Assessment Total Assessment is a certain percentage of the fair market value that is determined by local assessors to be the total taxable value of land and additions on the property. | Land | Improvement |
|---|---|---|---|---|
| 2024 | $1,599 | $75,300 | $15,600 | $59,700 |
| 2023 | $2,751 | $82,500 | $15,600 | $66,900 |
| 2022 | $1,700 | $79,600 | $15,600 | $64,000 |
| 2021 | $1,592 | $74,000 | $15,600 | $58,400 |
| 2020 | $1,595 | $74,000 | $15,600 | $58,400 |
| 2019 | $1,463 | $67,800 | $15,600 | $52,200 |
| 2018 | $1,639 | $67,200 | $15,600 | $51,600 |
| 2017 | $7,499 | $67,100 | $15,600 | $51,500 |
| 2016 | $2,452 | $66,500 | $15,600 | $50,900 |
| 2014 | $1,929 | $57,000 | $15,600 | $41,400 |
| 2013 | -- | $55,700 | $15,600 | $40,100 |
Property History
| Date | Event | Price | List to Sale | Price per Sq Ft |
|---|---|---|---|---|
| 11/03/2025 11/03/25 | Price Changed | $199,900 | -4.8% | $92 / Sq Ft |
| 10/24/2025 10/24/25 | Price Changed | $209,900 | -4.5% | $97 / Sq Ft |
| 10/16/2025 10/16/25 | Price Changed | $219,900 | -4.3% | $101 / Sq Ft |
| 10/03/2025 10/03/25 | For Sale | $229,900 | -- | $106 / Sq Ft |
Purchase History
| Date | Type | Sale Price | Title Company |
|---|---|---|---|
| Warranty Deed | $220,000 | None Listed On Document | |
| Warranty Deed | $83,900 | None Listed On Document | |
| Warranty Deed | -- | Agency Title | |
| Interfamily Deed Transfer | -- | -- | |
| Warranty Deed | -- | Agency Title |
Source: Southern Indiana REALTORS® Association
MLS Number: 2025011569
APN: 22-05-00-300-765.000-008
Disclaimer: Certain information contained herein is derived from information provided by parties other than Homes.com. All information provided is deemed reliable, but is not guaranteed to be accurate and should be independently verified.
![]() IDX information is provided exclusively for consumers’ personal, noncommercial use, and it may not be used for any purpose other than to identify prospective properties consumers may be interested in purchasing. Listing data is deemed reliable but is not guaranteed accurate by the SIRA MLS.
IDX information is provided exclusively for consumers’ personal, noncommercial use, and it may not be used for any purpose other than to identify prospective properties consumers may be interested in purchasing. Listing data is deemed reliable but is not guaranteed accurate by the SIRA MLS.
- 918 W Main St
- 219 W 9th St
- 220 W 8th St
- 613 W Market St
- 605 W 6th St
- 655 W 7th St
- 5102 Woodstone Circle Lot#161
- 628 W 9th St
- 700 W 8th St
- 911 Cherry St
- 3900 Corydon Pike
- 929 Valley View Rd
- 4513 Jewell Ave
- 1107 Griffin St
- 125 N 46th St
- 535 N 44th St
- 431 N 44th St
- 4609 W Market St
- 1202 Naghel St
- 3931 Northwestern Pkwy
- 739 W 8th St Unit 2
- 223 Main St
- 313 E Spring St
- 411 E Spring St
- 603 E Oak St
- 614 E Oak St
- 123 S 46th St
- 703 E Oak St
- 703 E Oak St
- 415 N 42nd St
- 1508 Beech St Unit B
- 111 N 43rd St
- 110 Albany St
- 3906 Jewell Ave
- 3908 Alford Ave
- 1201 Dewey St Unit 1
- 110 S 41st St
- 80 E 13th St Unit 1
- 1130 Greenaway Place
- 1308 E Main St Unit 1
