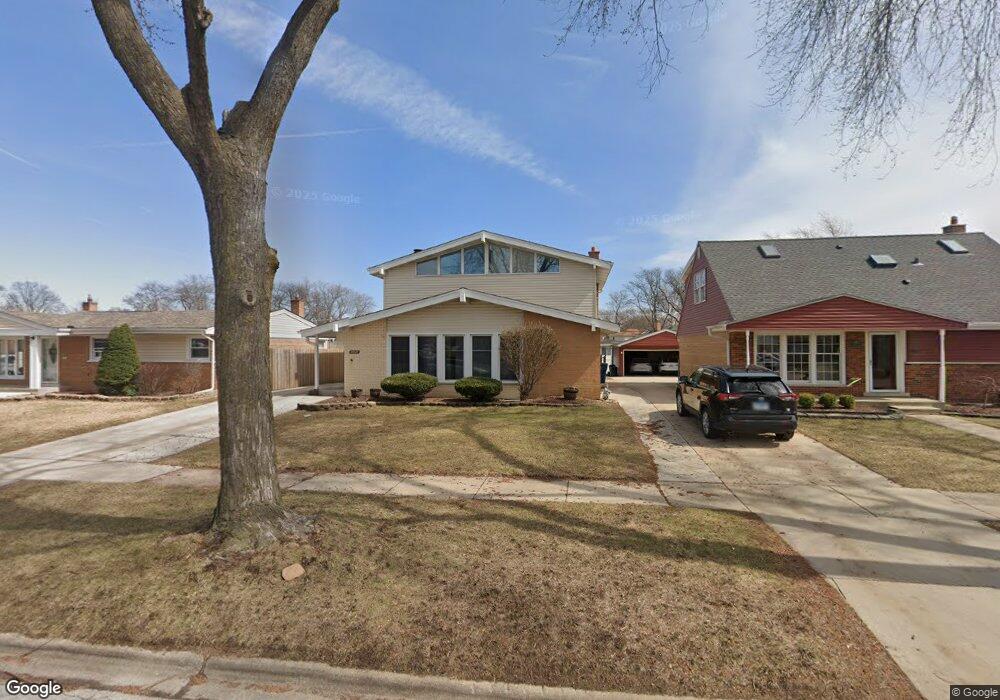
10021 Mulberry Ave Oak Lawn, IL 60453
Estimated Value: $329,000 - $410,000
4
Beds
2
Baths
2,005
Sq Ft
$189/Sq Ft
Est. Value
About This Home
This home is located at 10021 Mulberry Ave, Oak Lawn, IL 60453 and is currently estimated at $378,170, approximately $188 per square foot. 10021 Mulberry Ave is a home located in Cook County with nearby schools including Sward Elementary School, J Covington Elementary School, and Kolmar Avenue Elementary School.
Ownership History
Date
Name
Owned For
Owner Type
Purchase Details
Closed on
Aug 19, 2024
Sold by
Aguilera Antonio
Bought by
Velez Elizabeth C
Current Estimated Value
Purchase Details
Closed on
Jun 26, 2001
Sold by
Velez Elizabeth C
Bought by
Aguilera Antonio
Purchase Details
Closed on
Dec 16, 1999
Sold by
Kuschel Madelyn F and Flaherty Madelyn Kuschel
Bought by
Velez Elizabeth C
Home Financials for this Owner
Home Financials are based on the most recent Mortgage that was taken out on this home.
Original Mortgage
$150,800
Interest Rate
7.69%
Mortgage Type
Balloon
Purchase Details
Closed on
Sep 24, 1996
Sold by
Kuschel Robert A
Bought by
Kuschel Madelyn F
Home Financials for this Owner
Home Financials are based on the most recent Mortgage that was taken out on this home.
Original Mortgage
$47,350
Interest Rate
8%
Create a Home Valuation Report for This Property
The Home Valuation Report is an in-depth analysis detailing your home's value as well as a comparison with similar homes in the area
Home Values in the Area
Average Home Value in this Area
Purchase History
| Date | Buyer | Sale Price | Title Company |
|---|---|---|---|
| Velez Elizabeth C | -- | None Listed On Document | |
| Aguilera Antonio | -- | -- | |
| Velez Elizabeth C | $188,500 | Centennial Title Incorporate | |
| Kuschel Madelyn F | -- | -- |
Source: Public Records
Mortgage History
| Date | Status | Borrower | Loan Amount |
|---|---|---|---|
| Previous Owner | Velez Elizabeth C | $150,800 | |
| Previous Owner | Kuschel Madelyn F | $47,350 |
Source: Public Records
Tax History Compared to Growth
Tax History
| Year | Tax Paid | Tax Assessment Tax Assessment Total Assessment is a certain percentage of the fair market value that is determined by local assessors to be the total taxable value of land and additions on the property. | Land | Improvement |
|---|---|---|---|---|
| 2024 | $8,574 | $30,000 | $3,825 | $26,175 |
| 2023 | $9,627 | $30,000 | $3,825 | $26,175 |
| 2022 | $9,627 | $27,841 | $3,347 | $24,494 |
| 2021 | $9,403 | $27,839 | $3,346 | $24,493 |
| 2020 | $9,397 | $27,839 | $3,346 | $24,493 |
| 2019 | $7,272 | $22,396 | $3,028 | $19,368 |
| 2018 | $6,998 | $22,396 | $3,028 | $19,368 |
| 2017 | $7,635 | $23,804 | $3,028 | $20,776 |
| 2016 | $7,096 | $20,637 | $2,550 | $18,087 |
| 2015 | $6,943 | $20,637 | $2,550 | $18,087 |
| 2014 | $6,864 | $20,637 | $2,550 | $18,087 |
| 2013 | $7,276 | $23,847 | $2,550 | $21,297 |
Source: Public Records
Map
Nearby Homes
- 5509 Oak Center Dr
- 10100 Alice Ct
- 10210 Washington Ave Unit 305
- 10210 Washington Ave Unit 311
- 9828 Warren Ave
- 9807 Washington Ave
- 5733 W 101st Place
- 9935 Menard Ave
- 9735 S 55th Ave
- 10021 Cook Ave
- 5300 Oakdale Dr
- 9712 W Shore Dr
- 5700 Circle Dr Unit 101
- 10012 S 52nd Ave
- 9704 W Shore Dr
- 10360 Central Ave Unit 3C
- 5424 Franklin Ave
- 10420 Circle Dr Unit 22B
- 10016 Harnew Rd W
- 5120 W 101st St
- 10025 Mulberry Ave
- 10029 Mulberry Ave
- 10013 Mulberry Ave
- 10016 Buell Ct
- 10012 Buell Ct
- 10020 Buell Ct
- 10033 Mulberry Ave
- 10009 Mulberry Ave
- 10008 Buell Ct
- 10020 Mulberry Ave
- 10024 Buell Ct
- 10024 Mulberry Ave
- 10004 Buell Ct
- 10016 Mulberry Ave
- 10005 Mulberry Ave
- 10028 Mulberry Ave
- 10012 Mulberry Ave
- 10002 Buell Ct
- 5520 Oak Center Dr
- 5516 Oak Center Dr