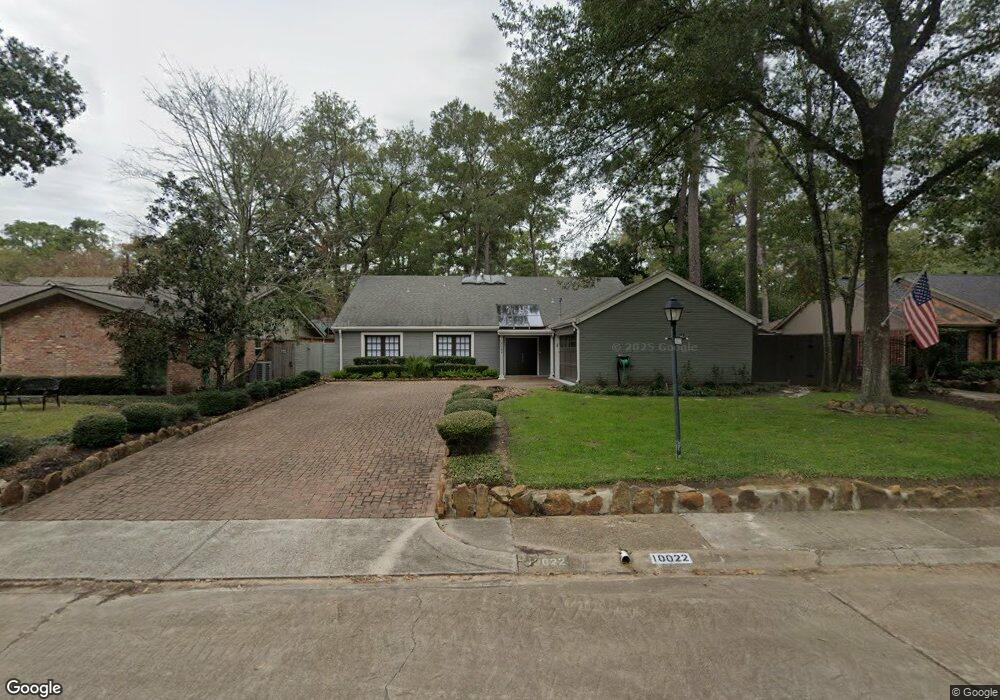
10022 Lynbrook Dr Houston, TX 77042
Briar Forest NeighborhoodEstimated Value: $771,501 - $878,000
3
Beds
3
Baths
2,407
Sq Ft
$337/Sq Ft
Est. Value
About This Home
This home is located at 10022 Lynbrook Dr, Houston, TX 77042 and is currently estimated at $811,875, approximately $337 per square foot. 10022 Lynbrook Dr is a home located in Harris County with nearby schools including Walnut Bend Elementary School, Paul Revere Middle School, and Westside High School.
Ownership History
Date
Name
Owned For
Owner Type
Purchase Details
Closed on
Aug 4, 2016
Sold by
Cheatham Charlie C and Cheatham Ada Huicongchen
Bought by
Li Simon M and Li Esther K
Current Estimated Value
Home Financials for this Owner
Home Financials are based on the most recent Mortgage that was taken out on this home.
Original Mortgage
$223,000
Outstanding Balance
$178,386
Interest Rate
3.56%
Mortgage Type
New Conventional
Estimated Equity
$633,489
Purchase Details
Closed on
Apr 18, 2013
Sold by
Nesbitt Charles S and Nesbitt Suzanna
Bought by
Cheatham Charlie C
Home Financials for this Owner
Home Financials are based on the most recent Mortgage that was taken out on this home.
Original Mortgage
$401,588
Interest Rate
2.37%
Mortgage Type
Adjustable Rate Mortgage/ARM
Purchase Details
Closed on
Apr 5, 2007
Sold by
Dickson Mary Jane
Bought by
Nesbitt Charles S
Home Financials for this Owner
Home Financials are based on the most recent Mortgage that was taken out on this home.
Original Mortgage
$253,500
Interest Rate
6.24%
Mortgage Type
Purchase Money Mortgage
Create a Home Valuation Report for This Property
The Home Valuation Report is an in-depth analysis detailing your home's value as well as a comparison with similar homes in the area
Home Values in the Area
Average Home Value in this Area
Purchase History
| Date | Buyer | Sale Price | Title Company |
|---|---|---|---|
| Li Simon M | -- | None Available | |
| Cheatham Charlie C | -- | Chicago Title | |
| Nesbitt Charles S | -- | Stewart Title Company |
Source: Public Records
Mortgage History
| Date | Status | Borrower | Loan Amount |
|---|---|---|---|
| Open | Li Simon M | $223,000 | |
| Previous Owner | Cheatham Charlie C | $401,588 | |
| Previous Owner | Nesbitt Charles S | $253,500 |
Source: Public Records
Tax History Compared to Growth
Tax History
| Year | Tax Paid | Tax Assessment Tax Assessment Total Assessment is a certain percentage of the fair market value that is determined by local assessors to be the total taxable value of land and additions on the property. | Land | Improvement |
|---|---|---|---|---|
| 2025 | $4,179 | $729,974 | $410,805 | $319,169 |
| 2024 | $4,179 | $692,813 | $410,805 | $282,008 |
| 2023 | $4,179 | $750,966 | $410,805 | $340,161 |
| 2022 | $14,668 | $715,735 | $410,805 | $304,930 |
| 2021 | $14,115 | $629,749 | $410,805 | $218,944 |
| 2020 | $13,332 | $616,236 | $410,805 | $205,431 |
| 2019 | $12,665 | $606,463 | $410,805 | $195,658 |
| 2018 | $5,692 | $455,000 | $219,096 | $235,904 |
| 2017 | $11,505 | $455,000 | $219,096 | $235,904 |
| 2016 | $16,163 | $639,204 | $219,096 | $420,108 |
| 2015 | $8,559 | $682,049 | $219,096 | $462,953 |
| 2014 | $8,559 | $422,725 | $219,096 | $203,629 |
Source: Public Records
Map
Nearby Homes
- 10034 Bordley Dr
- 10010 Bordley Dr
- 10121 Valley Forge Dr
- 10212 Longmont Dr Unit 44/7
- 1 Woodstone St
- 8 Woodstone St
- 10034 Briar Forest Dr
- 10042 Briar Forest Dr
- 10323 Pine Forest Rd
- 10 Warrenton Dr
- 3 Plantation Rd
- 10324 Briar Forest Dr Unit 28
- 10118 Briar Rose Dr
- 10276 Briar Forest Dr Unit 25
- 10378 Briar Forest Dr Unit 32/5
- 150 Gessner Rd Unit 5A
- 10031 Inwood Dr
- 10317 Briar Forest Dr Unit 214
- 0 Gessner Rd
- 170 Haversham Dr
- 10018 Lynbrook Dr
- 10026 Lynbrook Dr
- 10019 Sugar Hill Dr
- 10015 Sugar Hill Dr
- 10023 Sugar Hill Dr
- 10014 Lynbrook Dr
- 10032 Lynbrook Dr
- 10023 Lynbrook Dr
- 10027 Lynbrook Dr
- 10011 Sugar Hill Dr
- 10027 Sugar Hill Dr
- 10019 Lynbrook Dr
- 10031 Lynbrook Dr
- 10036 Lynbrook Dr
- 10010 Lynbrook Dr
- 10015 Lynbrook Dr
- 10007 Sugar Hill Dr
- 10031 Sugar Hill Dr
- 10035 Lynbrook Dr
- 10018 Sugar Hill Dr