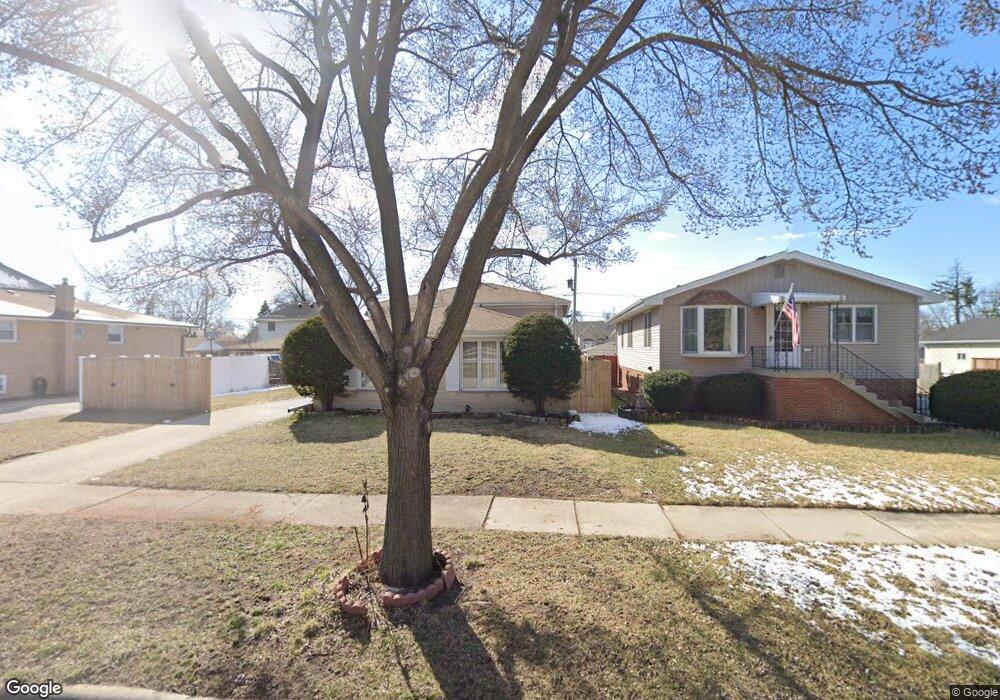
10022 Moody Ave Oak Lawn, IL 60453
Estimated Value: $308,000
--
Bed
--
Bath
1,020
Sq Ft
$302/Sq Ft
Est. Value
About This Home
This home is located at 10022 Moody Ave, Oak Lawn, IL 60453 and is currently estimated at $308,000, approximately $301 per square foot. 10022 Moody Ave is a home located in Cook County with nearby schools including Columbus Manor Elementary School, Simmons Middle School, and Harold L. Richards High School.
Ownership History
Date
Name
Owned For
Owner Type
Purchase Details
Closed on
Sep 4, 2018
Sold by
Cervantes Luis R and Cervantes Veronica
Bought by
Alfahmawi Nabeel
Current Estimated Value
Home Financials for this Owner
Home Financials are based on the most recent Mortgage that was taken out on this home.
Original Mortgage
$190,350
Outstanding Balance
$166,540
Interest Rate
4.75%
Mortgage Type
New Conventional
Estimated Equity
$141,460
Purchase Details
Closed on
Aug 18, 2009
Sold by
Federal Home Loan Mortgage Corporation
Bought by
Cervantes Luis R and Cervantes Veronica
Home Financials for this Owner
Home Financials are based on the most recent Mortgage that was taken out on this home.
Original Mortgage
$169,100
Interest Rate
5.27%
Mortgage Type
New Conventional
Purchase Details
Closed on
Jan 15, 2009
Sold by
Aburish Mohammad
Bought by
Federal Home Loan Mortgage Corp
Create a Home Valuation Report for This Property
The Home Valuation Report is an in-depth analysis detailing your home's value as well as a comparison with similar homes in the area
Home Values in the Area
Average Home Value in this Area
Purchase History
| Date | Buyer | Sale Price | Title Company |
|---|---|---|---|
| Alfahmawi Nabeel | $211,500 | Stewart Title | |
| Cervantes Luis R | $180,000 | Attorneys Title Guaranty Fun | |
| Federal Home Loan Mortgage Corp | -- | None Available |
Source: Public Records
Mortgage History
| Date | Status | Borrower | Loan Amount |
|---|---|---|---|
| Open | Alfahmawi Nabeel | $190,350 | |
| Previous Owner | Cervantes Luis R | $169,100 |
Source: Public Records
Tax History Compared to Growth
Tax History
| Year | Tax Paid | Tax Assessment Tax Assessment Total Assessment is a certain percentage of the fair market value that is determined by local assessors to be the total taxable value of land and additions on the property. | Land | Improvement |
|---|---|---|---|---|
| 2024 | $971 | $3,174 | $2,625 | $549 |
| 2023 | $1,026 | $3,174 | $2,625 | $549 |
| 2022 | $1,026 | $2,799 | $2,250 | $549 |
| 2021 | $990 | $2,799 | $2,250 | $549 |
| 2020 | $981 | $2,799 | $2,250 | $549 |
| 2019 | $902 | $2,611 | $2,062 | $549 |
| 2018 | $865 | $2,611 | $2,062 | $549 |
| 2017 | $887 | $2,611 | $2,062 | $549 |
| 2016 | $806 | $2,236 | $1,687 | $549 |
| 2015 | $797 | $2,236 | $1,687 | $549 |
| 2014 | $787 | $2,236 | $1,687 | $549 |
| 2013 | $720 | $2,236 | $1,687 | $549 |
Source: Public Records
Map
Nearby Homes
- 10030 Moody Ave
- 10005 Moody Ave
- 9912 Austin Ave
- 9827 Melvina Ave
- 6120 W 98th St
- 6027 103rd St Unit 1
- 10440 S Mayfield Ave Unit 1A
- 10306 Kerry Ridge Ct
- 6131 Marshall Ave Unit 1W
- 10301 Mcvicker Ave
- 9714 Mcvicker Ave
- 9729 Merton Ave
- 9725 Ridgeland Ave Unit 1N
- 6345 Birmingham St Unit 3C
- 9935 Menard Ave
- 10330 Mayfield Ave Unit 2N
- 5733 W 101st Place
- 6517 102nd Place
- 10429 Austin Ave Unit A
- 9611 Merton Ave
- 10022 Moody Ave
- 10018 Moody Ave
- 10018 Moody Ave
- 10012 Moody Ave
- 10026 Moody Ave
- 10026 Moody Ave
- 10019 Melvina Ave
- 10019 Melvina Ave
- 10015 Melvina Ave
- 10015 Melvina Ave
- 10023 Melvina Ave
- 10011 Melvina Ave
- 10011 Melvina Ave
- 10017 Moody Ave
- 10008 Moody Ave
- 10029 Melvina Ave
- 10009 Melvina Ave
- 10009 Melvina Ave
- 10015 Moody Ave
- 10015 Moody Ave