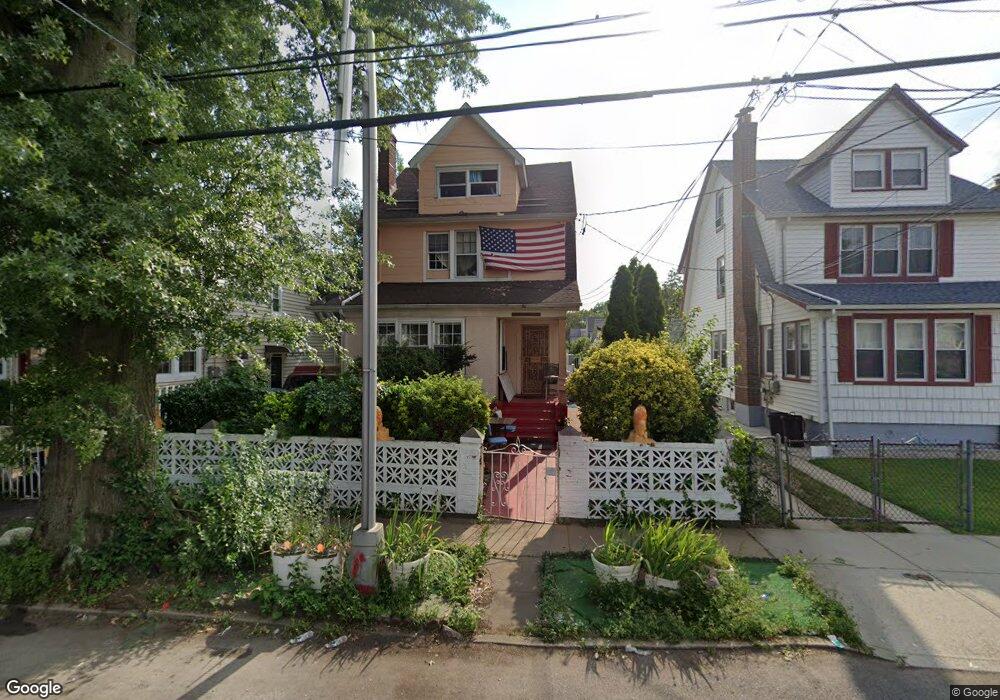
10024 208th St Queens Village, NY 11429
Queens Village NeighborhoodEstimated Value: $830,000 - $1,046,000
--
Bed
--
Bath
1,996
Sq Ft
$468/Sq Ft
Est. Value
About This Home
This home is located at 10024 208th St, Queens Village, NY 11429 and is currently estimated at $933,526, approximately $467 per square foot. 10024 208th St is a home located in Queens County with nearby schools including P.S. 134 Langston Hughes School, I.S. 192 The Linden, and Incarnation Catholic Academy.
Ownership History
Date
Name
Owned For
Owner Type
Purchase Details
Closed on
Sep 27, 2024
Sold by
Harrypersaud Latchman
Bought by
Harrypersaud Latchman and Harrypersaud Sabetri
Current Estimated Value
Purchase Details
Closed on
Jun 18, 2024
Sold by
912 15 Street Group Corp
Bought by
Harrypersaud Latchman
Home Financials for this Owner
Home Financials are based on the most recent Mortgage that was taken out on this home.
Original Mortgage
$499,000
Outstanding Balance
$492,534
Interest Rate
6.94%
Mortgage Type
Purchase Money Mortgage
Estimated Equity
$440,992
Purchase Details
Closed on
Jul 17, 2018
Sold by
Deutsche Bank National Trust Company and % : Ocwen Loan Servicing Llc
Bought by
912 15 Street Group Corp
Purchase Details
Closed on
Feb 26, 2010
Sold by
Matthew M Lupoli Esq As Referee
Bought by
Series 2004-1 and Deutsche Bank National Trust Company
Create a Home Valuation Report for This Property
The Home Valuation Report is an in-depth analysis detailing your home's value as well as a comparison with similar homes in the area
Home Values in the Area
Average Home Value in this Area
Purchase History
| Date | Buyer | Sale Price | Title Company |
|---|---|---|---|
| Harrypersaud Latchman | -- | -- | |
| Harrypersaud Latchman | $999,000 | -- | |
| 912 15 Street Group Corp | $354,000 | -- | |
| 912 15 Street Group Corp | $354,000 | -- | |
| Series 2004-1 | $330,000 | -- | |
| Series 2004-1 | $330,000 | -- |
Source: Public Records
Mortgage History
| Date | Status | Borrower | Loan Amount |
|---|---|---|---|
| Open | Harrypersaud Latchman | $499,000 |
Source: Public Records
Tax History Compared to Growth
Tax History
| Year | Tax Paid | Tax Assessment Tax Assessment Total Assessment is a certain percentage of the fair market value that is determined by local assessors to be the total taxable value of land and additions on the property. | Land | Improvement |
|---|---|---|---|---|
| 2025 | $5,953 | $36,818 | $11,710 | $25,108 |
| 2024 | $5,953 | $29,640 | $15,236 | $14,404 |
| 2023 | $6,228 | $31,008 | $19,372 | $11,636 |
| 2022 | $4,597 | $82,800 | $36,000 | $46,800 |
| 2021 | $4,268 | $78,750 | $36,000 | $42,750 |
| 2020 | $4,018 | $95,850 | $36,000 | $59,850 |
| 2019 | $3,762 | $80,550 | $36,000 | $44,550 |
| 2018 | $3,794 | $29,828 | $14,408 | $15,420 |
| 2017 | $3,676 | $28,902 | $14,808 | $14,094 |
| 2016 | $3,450 | $28,902 | $14,808 | $14,094 |
| 2015 | $2,737 | $24,780 | $19,023 | $5,757 |
| 2014 | $2,737 | $22,945 | $14,101 | $8,844 |
Source: Public Records
Map
Nearby Homes
- 100-28 207th St
- 208-17 100th Ave
- 100-24 210th St
- 99-03 207th St
- 104-24 210th St
- 10437 205th Place
- 104-50 210th St
- 204-20 104th Ave
- 9427 208th St
- 109-12 Francis Lewis Blvd
- 10925 208th St
- 211-35 99th Ave
- 9904 212th St
- 9353 207th St
- 99-02 212th St
- 99-02 212 St
- 204-06 109th Ave
- 9903 212th St
- 21215 104th Rd
- 9331 207th St
- 100-24 208th St
- 10020 208th St
- 10028 208th St
- 100-20 208th St
- 10032 208th St
- 10016 208th St
- 10023 207th St
- 10019 207th St
- 10027 207th St
- 10027 207th St
- 10036 208th St
- 10012 208th St
- 100-19 207th St
- 10015 207th St
- 10031 207th St
- 10031 207th St
- 100-31 207th St
- 10011 207th St
- 10040 208th St
- 10035 207th St