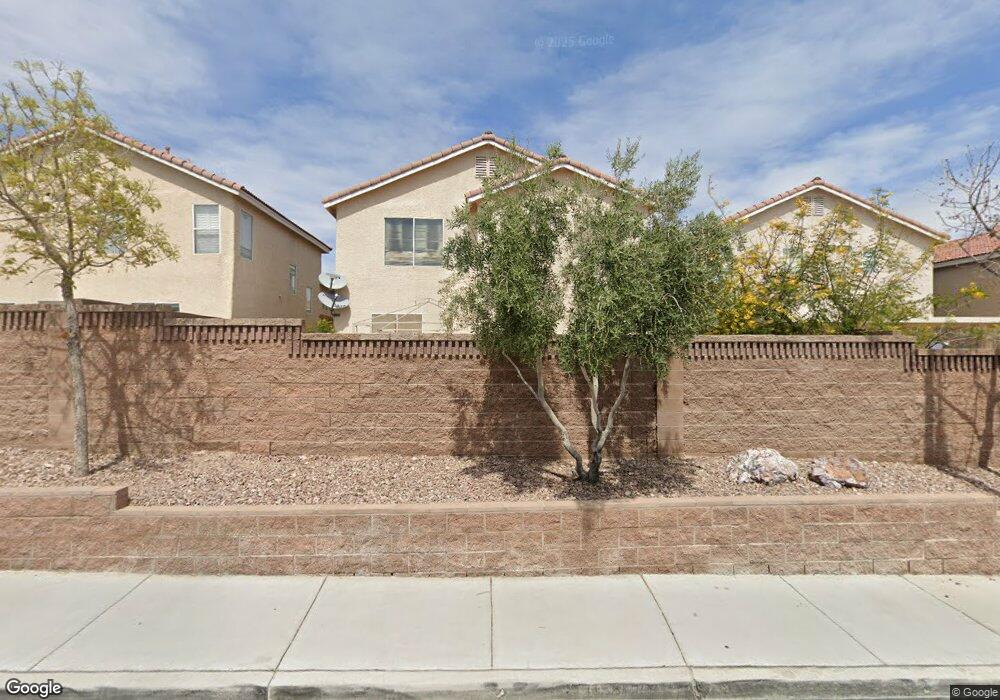
10024 Capistrello Ave Unit 1 Las Vegas, NV 89147
Estimated Value: $481,000 - $490,000
4
Beds
3
Baths
1,885
Sq Ft
$257/Sq Ft
Est. Value
About This Home
This home is located at 10024 Capistrello Ave Unit 1, Las Vegas, NV 89147 and is currently estimated at $484,515, approximately $257 per square foot. 10024 Capistrello Ave Unit 1 is a home located in Clark County with nearby schools including Sandra B Abston Elementary School, Victoria Fertitta Middle School, and Durango High School.
Ownership History
Date
Name
Owned For
Owner Type
Purchase Details
Closed on
Jul 9, 2019
Sold by
Solari Dennis G
Bought by
Rlt Solari Dennis Gerald and Dennis Gerald Solari Rlt
Current Estimated Value
Purchase Details
Closed on
Sep 22, 2011
Sold by
Dragg Stephen S and Dragg Rosemary
Bought by
Solari Dennis G
Home Financials for this Owner
Home Financials are based on the most recent Mortgage that was taken out on this home.
Original Mortgage
$128,000
Outstanding Balance
$87,654
Interest Rate
4.26%
Mortgage Type
New Conventional
Estimated Equity
$396,861
Purchase Details
Closed on
Sep 25, 2000
Sold by
Bilt Perma
Bought by
Dragg Stephen S and Dragg Rosemary
Home Financials for this Owner
Home Financials are based on the most recent Mortgage that was taken out on this home.
Original Mortgage
$80,000
Interest Rate
8.07%
Create a Home Valuation Report for This Property
The Home Valuation Report is an in-depth analysis detailing your home's value as well as a comparison with similar homes in the area
Home Values in the Area
Average Home Value in this Area
Purchase History
| Date | Buyer | Sale Price | Title Company |
|---|---|---|---|
| Rlt Solari Dennis Gerald | -- | None Available | |
| Solari Dennis G | $160,000 | Equity Title Of Nevada | |
| Dragg Stephen S | $159,165 | Land Title |
Source: Public Records
Mortgage History
| Date | Status | Borrower | Loan Amount |
|---|---|---|---|
| Open | Solari Dennis G | $128,000 | |
| Previous Owner | Dragg Stephen S | $80,000 |
Source: Public Records
Tax History Compared to Growth
Tax History
| Year | Tax Paid | Tax Assessment Tax Assessment Total Assessment is a certain percentage of the fair market value that is determined by local assessors to be the total taxable value of land and additions on the property. | Land | Improvement |
|---|---|---|---|---|
| 2025 | $1,923 | $108,618 | $39,900 | $68,718 |
| 2024 | $1,868 | $108,618 | $39,900 | $68,718 |
| 2023 | $1,524 | $100,039 | $35,000 | $65,039 |
| 2022 | $1,813 | $89,193 | $29,750 | $59,443 |
| 2021 | $1,761 | $83,504 | $26,950 | $56,554 |
| 2020 | $1,706 | $82,012 | $25,900 | $56,112 |
| 2019 | $1,657 | $76,894 | $21,700 | $55,194 |
| 2018 | $1,608 | $71,674 | $18,900 | $52,774 |
| 2017 | $2,081 | $70,939 | $17,500 | $53,439 |
| 2016 | $1,524 | $66,339 | $12,950 | $53,389 |
| 2015 | $1,520 | $52,960 | $10,850 | $42,110 |
| 2014 | $1,476 | $48,817 | $8,750 | $40,067 |
Source: Public Records
Map
Nearby Homes
- 4645 Altina St
- 10001 Peace Way Unit 2309
- 10001 Peace Way Unit 2276
- 10001 Peace Way Unit 2322
- 10001 Peace Way Unit 2181
- 10001 Peace Way Unit 1296
- 4786 Castel Martini Ct
- 10188 Campo Tizzoro
- 9844 Ashton Pines Ct
- 4672 Regalo Bello St
- 9975 Peace Way Unit 2174
- 9975 Peace Way Unit 1149
- 4615 Regalo Bello St
- 4814 Regalo Bello St Unit 4
- 9794 Villa Lorena Ave
- 4508 Regalo Bello St Unit 6
- 4750 Fiore Bella Blvd
- 10034 White Mulberry Dr
- 10255 Riva de Angelo Ave
- 9748 Villa Lorena Ave
- 10018 Capistrello Ave
- 4667 Nocera St
- 10012 Capistrello Ave
- 4659 Nocera St Unit 1
- 10025 Capistrello Ave
- 10025 Carsoli Ct
- 4651 Nocera St Unit n/a
- 4651 Nocera St
- 10019 Capistrello Ave Unit 1
- 10031 Capistrello Ave
- 10019 Carsoli Ct
- 10006 Capistrello Ave
- 10037 Capistrello Ave
- 10013 Capistrello Ave
- 4643 Nocera St
- 10013 Carsoli Ct
- 10013 Carsoli Ct Unit na
- 10043 Capistrello Ave
- 10007 Capistrello Ave
- 10007 Carsoli Ct