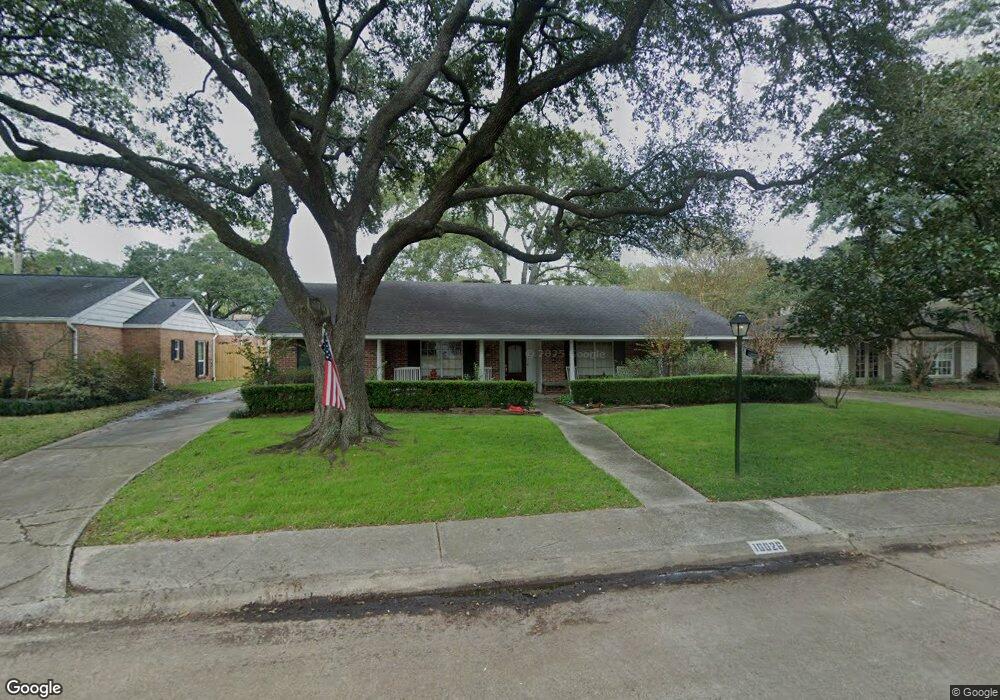
10026 Inwood Dr Houston, TX 77042
Briar Forest NeighborhoodEstimated Value: $697,329 - $771,000
4
Beds
2
Baths
2,070
Sq Ft
$357/Sq Ft
Est. Value
About This Home
This home is located at 10026 Inwood Dr, Houston, TX 77042 and is currently estimated at $738,582, approximately $356 per square foot. 10026 Inwood Dr is a home located in Harris County with nearby schools including Walnut Bend Elementary School, Paul Revere Middle School, and Westside High School.
Ownership History
Date
Name
Owned For
Owner Type
Purchase Details
Closed on
Apr 9, 2009
Sold by
Rosser Matthew W and Rosser Jennifer B
Bought by
Dale Richard and Dale Ann
Current Estimated Value
Home Financials for this Owner
Home Financials are based on the most recent Mortgage that was taken out on this home.
Original Mortgage
$295,200
Outstanding Balance
$188,807
Interest Rate
5.16%
Mortgage Type
Purchase Money Mortgage
Estimated Equity
$549,775
Purchase Details
Closed on
Oct 1, 1998
Sold by
Stirl Mark E and Stirl Marlene L
Bought by
Rosser Matthew W and Rosser Jennifer B
Home Financials for this Owner
Home Financials are based on the most recent Mortgage that was taken out on this home.
Original Mortgage
$168,000
Interest Rate
6.92%
Purchase Details
Closed on
Jan 16, 1998
Sold by
Morrow John W and Morrow Connie
Bought by
Stirl Marlene
Purchase Details
Closed on
Jan 27, 1997
Sold by
Morrow John W and Morrow Connie
Bought by
Stirl Marlene
Purchase Details
Closed on
Jan 15, 1996
Sold by
Morrow John W and Morrow Connie
Bought by
Stirl Marlene
Purchase Details
Closed on
Dec 23, 1995
Sold by
Morrow John W and Morrow Connie
Bought by
Stirl Marlene
Create a Home Valuation Report for This Property
The Home Valuation Report is an in-depth analysis detailing your home's value as well as a comparison with similar homes in the area
Home Values in the Area
Average Home Value in this Area
Purchase History
| Date | Buyer | Sale Price | Title Company |
|---|---|---|---|
| Dale Richard | -- | Old Republic Title Company O | |
| Rosser Matthew W | -- | Commonwealth Land Title Co | |
| Stirl Marlene | -- | -- | |
| Stirl Marlene | -- | -- | |
| Stirl Marlene | -- | -- | |
| Stirl Marlene | -- | -- |
Source: Public Records
Mortgage History
| Date | Status | Borrower | Loan Amount |
|---|---|---|---|
| Open | Dale Richard | $295,200 | |
| Previous Owner | Rosser Matthew W | $168,000 | |
| Closed | Rosser Matthew W | $44,800 |
Source: Public Records
Tax History Compared to Growth
Tax History
| Year | Tax Paid | Tax Assessment Tax Assessment Total Assessment is a certain percentage of the fair market value that is determined by local assessors to be the total taxable value of land and additions on the property. | Land | Improvement |
|---|---|---|---|---|
| 2025 | $4,683 | $633,680 | $383,243 | $250,437 |
| 2024 | $4,683 | $580,095 | $383,243 | $196,852 |
| 2023 | $4,683 | $616,500 | $383,243 | $233,257 |
| 2022 | $11,704 | $578,000 | $383,243 | $194,757 |
| 2021 | $11,262 | $483,209 | $383,243 | $99,966 |
| 2020 | $12,035 | $497,000 | $383,243 | $113,757 |
| 2019 | $11,741 | $464,000 | $383,243 | $80,757 |
| 2018 | $8,935 | $454,023 | $221,429 | $232,594 |
| 2017 | $12,011 | $475,000 | $221,429 | $253,571 |
| 2016 | $11,343 | $475,000 | $221,429 | $253,571 |
| 2015 | $7,484 | $517,500 | $221,429 | $296,071 |
| 2014 | $7,484 | $418,761 | $187,363 | $231,398 |
Source: Public Records
Map
Nearby Homes
- 10031 Inwood Dr
- 10034 Briar Forest Dr
- 10042 Briar Forest Dr
- 10118 Briar Rose Dr
- 10010 Burgoyne Rd
- 10211 Olympia Dr
- 10203 Meadow Lake Ln
- 10303 Chevy Chase Dr
- 10206 Burgoyne Rd
- 10121 Valley Forge Dr
- 10218 Burgoyne Rd
- 1691 W Sam Houston Pkwy S
- 10276 Briar Forest Dr Unit 25
- 10317 Briar Forest Dr Unit 214
- 2219 Briar Branch Dr
- 10324 Briar Forest Dr Unit 28
- 1537 W Sam Houston Pkwy S
- 10315 Meadow Lake Ln
- 10378 Briar Forest Dr Unit 32/5
- 10010 Bordley Dr
- 10022 Inwood Dr
- 10030 Inwood Dr
- 10027 Briar Rose Dr
- 10023 Briar Rose Dr
- 10031 Briar Rose Dr
- 10018 Inwood Dr
- 10034 Inwood Dr
- 10027 Inwood Dr
- 10019 Briar Rose Dr
- 10035 Briar Rose Dr
- 10023 Inwood Dr
- 10035 Inwood Dr
- 10014 Inwood Dr
- 10038 Inwood Dr
- 10015 Briar Rose Dr
- 10019 Inwood Dr
- 10039 Briar Rose Dr
- 10039 Inwood Dr
- 10022 Briar Rose Dr
- 10026 Briar Rose Dr