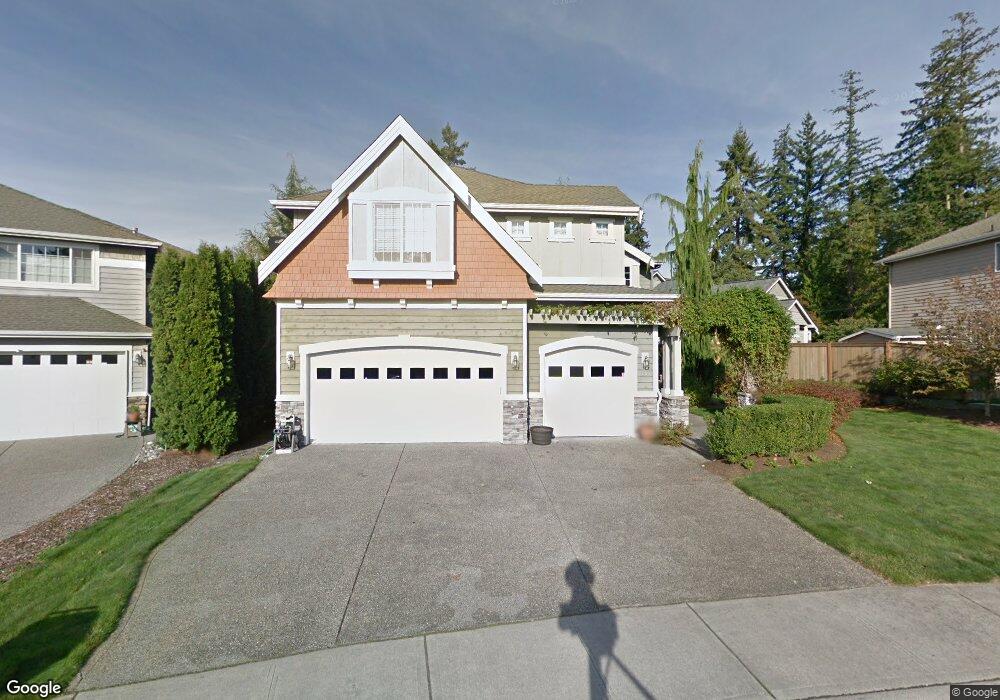
1003 204th Place SW Lynnwood, WA 98036
Queensborough-Brentwood NeighborhoodEstimated Value: $1,178,580 - $1,241,000
4
Beds
3
Baths
3,005
Sq Ft
$401/Sq Ft
Est. Value
About This Home
This home is located at 1003 204th Place SW, Lynnwood, WA 98036 and is currently estimated at $1,205,395, approximately $401 per square foot. 1003 204th Place SW is a home located in Snohomish County with nearby schools including Hilltop Elementary School, Brier Terrace Middle School, and Mountlake Terrace High School.
Ownership History
Date
Name
Owned For
Owner Type
Purchase Details
Closed on
Sep 14, 2020
Sold by
Chea Zorato Sok and Chea Ruth Bagaporo
Bought by
Chea Rato S and Chea Ruth
Current Estimated Value
Home Financials for this Owner
Home Financials are based on the most recent Mortgage that was taken out on this home.
Original Mortgage
$270,402
Outstanding Balance
$214,876
Interest Rate
2.71%
Mortgage Type
New Conventional
Estimated Equity
$990,519
Purchase Details
Closed on
Mar 11, 2019
Sold by
Bagaporo Chea Rato Sok and Bagaporo Chea Ruth
Bought by
Bagaporo Chea Rato Sok and Bagaporo Chea Ruth
Purchase Details
Closed on
Mar 14, 2003
Sold by
Tim Canfield Construction Inc
Bought by
Chea Rato S and Chea Ruth B
Home Financials for this Owner
Home Financials are based on the most recent Mortgage that was taken out on this home.
Original Mortgage
$334,360
Interest Rate
5.82%
Create a Home Valuation Report for This Property
The Home Valuation Report is an in-depth analysis detailing your home's value as well as a comparison with similar homes in the area
Home Values in the Area
Average Home Value in this Area
Purchase History
| Date | Buyer | Sale Price | Title Company |
|---|---|---|---|
| Chea Rato S | -- | Vantage Point Title Inc | |
| Bagaporo Chea Rato Sok | -- | None Available | |
| Chea Rato S | $417,950 | Chicago Title |
Source: Public Records
Mortgage History
| Date | Status | Borrower | Loan Amount |
|---|---|---|---|
| Open | Chea Rato S | $270,402 | |
| Closed | Chea Rato S | $334,360 | |
| Closed | Chea Rato S | $41,795 |
Source: Public Records
Tax History Compared to Growth
Tax History
| Year | Tax Paid | Tax Assessment Tax Assessment Total Assessment is a certain percentage of the fair market value that is determined by local assessors to be the total taxable value of land and additions on the property. | Land | Improvement |
|---|---|---|---|---|
| 2025 | $7,675 | $984,700 | $535,000 | $449,700 |
| 2024 | $7,675 | $929,100 | $495,000 | $434,100 |
| 2023 | $8,853 | $1,124,200 | $630,000 | $494,200 |
| 2022 | $7,634 | $787,500 | $363,000 | $424,500 |
| 2020 | $9,222 | $843,000 | $401,000 | $442,000 |
| 2019 | $7,847 | $712,800 | $275,000 | $437,800 |
| 2018 | $7,989 | $639,700 | $245,000 | $394,700 |
| 2017 | $6,652 | $551,200 | $180,000 | $371,200 |
| 2016 | $6,317 | $525,600 | $170,000 | $355,600 |
| 2015 | $6,331 | $500,800 | $155,000 | $345,800 |
| 2013 | $5,444 | $408,700 | $140,000 | $268,700 |
Source: Public Records
Map
Nearby Homes
- 20914 13th Place W
- 0 Larch Way Unit NWM2427085
- 604 213th St SW
- 1815 201st Place SW
- 20901 Cypress Way Unit 16
- 19505 Damson Rd Unit C1
- 19505 Damson Rd Unit C3
- 319 196th Place SW Unit 102
- 212 xx Cypress Way
- 19403 7th Ave W Unit C1
- 19 198th Place SE
- 123 194th Place SW
- 19225 Damson Rd Unit N-2
- 525 218th St SW
- 1919 196th St SW Unit 61
- 20325 24th Place W
- 309 207th Place SE
- 114 212th St SE
- 19726 Filbert Dr
- 317 207th St SE
- 1005 204th Place SW
- 927 204th Place SW
- 907 204th Place SW
- 20408 Crawford Rd
- 20326 10th Ave W
- 1011 204th Place SW
- 1008 204th Place SW
- 20330 10th Ave W
- 930 204th Place SW
- 1013 204th Place SW
- 1012 204th Place SW
- 20330 Crawford Rd
- 1017 204th Place SW
- 20419 Crawford Rd
- 1021 204th Place SW
- 921 205th St SW
- 20420 Crawford Rd
- 20325 10th Ave W
- 20316 10th Ave W
- 1016 204th Place SW