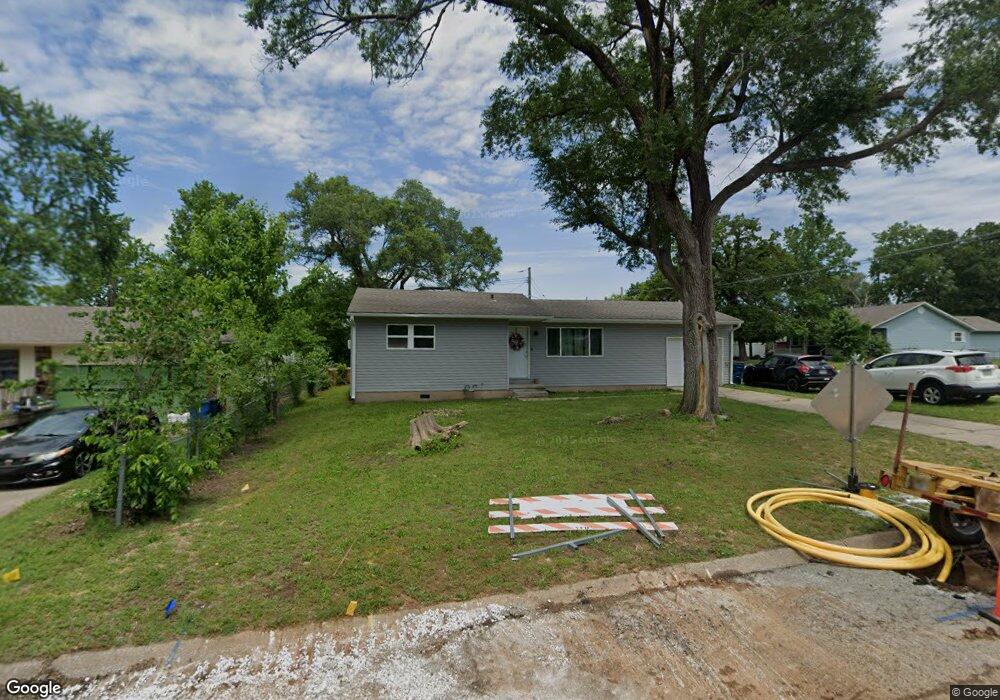
1003 Ash St Carthage, MO 64836
Estimated Value: $129,588 - $162,000
Studio
1
Bath
992
Sq Ft
$143/Sq Ft
Est. Value
About This Home
This home is located at 1003 Ash St, Carthage, MO 64836 and is currently estimated at $141,647, approximately $142 per square foot. 1003 Ash St is a home located in Jasper County with nearby schools including Carthage High School, St. Ann's Catholic School, and Victory Academy.
Ownership History
Date
Name
Owned For
Owner Type
Purchase Details
Closed on
Sep 13, 2022
Sold by
Hg Rentals Llc
Bought by
Leslie Shane Dale and Robertson Lauren Rebecca
Current Estimated Value
Home Financials for this Owner
Home Financials are based on the most recent Mortgage that was taken out on this home.
Original Mortgage
$130,303
Outstanding Balance
$124,043
Interest Rate
4.99%
Mortgage Type
New Conventional
Estimated Equity
$17,604
Purchase Details
Closed on
Nov 19, 2021
Sold by
Couch Nicholas M and Couch Kandy
Bought by
Hg Rentals Llc
Home Financials for this Owner
Home Financials are based on the most recent Mortgage that was taken out on this home.
Original Mortgage
$37,000
Interest Rate
3.09%
Mortgage Type
Stand Alone Refi Refinance Of Original Loan
Purchase Details
Closed on
Dec 28, 2020
Sold by
Couch Nicholas M and Couch Karen S
Bought by
Couch Nicholas M and Couch Karen S
Create a Home Valuation Report for This Property
The Home Valuation Report is an in-depth analysis detailing your home's value as well as a comparison with similar homes in the area
Home Values in the Area
Average Home Value in this Area
Purchase History
| Date | Buyer | Sale Price | Title Company |
|---|---|---|---|
| Leslie Shane Dale | -- | -- | |
| Hg Rentals Llc | -- | None Available | |
| Couch Nicholas M | -- | None Listed On Document |
Source: Public Records
Mortgage History
| Date | Status | Borrower | Loan Amount |
|---|---|---|---|
| Open | Leslie Shane Dale | $130,303 | |
| Previous Owner | Hg Rentals Llc | $37,000 |
Source: Public Records
Tax History
| Year | Tax Paid | Tax Assessment Tax Assessment Total Assessment is a certain percentage of the fair market value that is determined by local assessors to be the total taxable value of land and additions on the property. | Land | Improvement |
|---|---|---|---|---|
| 2025 | $658 | $14,370 | $1,880 | $12,490 |
| 2024 | $658 | $12,780 | $1,880 | $10,900 |
| 2023 | $658 | $12,780 | $1,880 | $10,900 |
| 2022 | $387 | $7,540 | $1,880 | $5,660 |
| 2021 | $383 | $7,540 | $1,880 | $5,660 |
| 2020 | $462 | $8,730 | $1,880 | $6,850 |
| 2019 | $463 | $8,730 | $1,880 | $6,850 |
| 2018 | $448 | $8,470 | $0 | $0 |
| 2017 | $449 | $8,470 | $0 | $0 |
| 2016 | $448 | $8,470 | $0 | $0 |
| 2015 | $414 | $8,470 | $0 | $0 |
| 2014 | $414 | $8,470 | $0 | $0 |
Source: Public Records
Map
Nearby Homes
- 1103 Ash St
- 1506 Sophia St
- 1143 S Case St
- 831 Rombauer Ave
- 504 Cooper St
- 1014 Sycamore St
- 414 Pine St
- 1615 Forest St
- 514 Poplar St
- 1112 S Garrison Ave
- 1515 S Garrison Ave
- 1160 S Maple St
- 1131 Lyon St
- 303 W Centennial Ave
- 431 S Orner St
- 802 Oak St
- 509 W Highland Ave
- 1101 Oak St
- 1144 S Main St
- 1513 S Main St