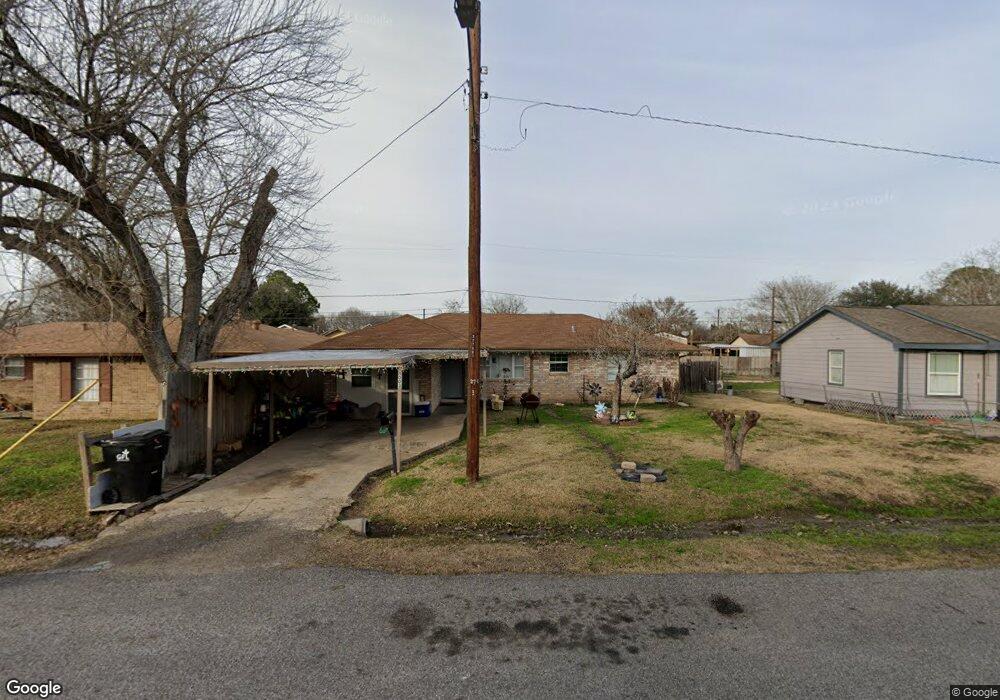
1003 Avenue E Rosenberg, TX 77471
Estimated Value: $145,535 - $174,000
1
Bed
1
Bath
997
Sq Ft
$162/Sq Ft
Est. Value
About This Home
This home is located at 1003 Avenue E, Rosenberg, TX 77471 and is currently estimated at $161,178, approximately $161 per square foot. 1003 Avenue E is a home located in Fort Bend County with nearby schools including Travis Elementary School, George Junior High School, and B.F. Terry High School.
Ownership History
Date
Name
Owned For
Owner Type
Purchase Details
Closed on
May 3, 2010
Sold by
Reventures Inc
Bought by
Crossfield Venturs Inc
Current Estimated Value
Purchase Details
Closed on
Sep 19, 2002
Sold by
Rios Israel R
Bought by
Crossfield Ventures Inc
Purchase Details
Closed on
Sep 16, 2002
Sold by
Aames Funding Corp
Bought by
Reventures Inc
Purchase Details
Closed on
Aug 6, 2002
Sold by
Rios Israel R
Bought by
Aames Funding Corp
Create a Home Valuation Report for This Property
The Home Valuation Report is an in-depth analysis detailing your home's value as well as a comparison with similar homes in the area
Home Values in the Area
Average Home Value in this Area
Purchase History
| Date | Buyer | Sale Price | Title Company |
|---|---|---|---|
| Crossfield Venturs Inc | -- | None Available | |
| Crossfield Ventures Inc | -- | -- | |
| Crossfield Ventures Inc | -- | -- | |
| Reventures Inc | -- | Chicago Title | |
| Crossfield Ventures Inc | -- | -- | |
| Aames Funding Corp | $32,520 | -- |
Source: Public Records
Tax History
| Year | Tax Paid | Tax Assessment Tax Assessment Total Assessment is a certain percentage of the fair market value that is determined by local assessors to be the total taxable value of land and additions on the property. | Land | Improvement |
|---|---|---|---|---|
| 2025 | $2,940 | $139,713 | $34,840 | $104,873 |
| 2024 | $2,940 | $155,655 | $34,840 | $120,815 |
| 2023 | $2,849 | $147,580 | $26,532 | $121,048 |
| 2022 | $2,400 | $117,180 | $26,530 | $90,650 |
| 2021 | $1,838 | $88,610 | $26,530 | $62,080 |
| 2020 | $1,880 | $88,580 | $26,530 | $62,050 |
| 2019 | $2,091 | $91,570 | $26,530 | $65,040 |
| 2018 | $1,131 | $48,720 | $22,400 | $26,320 |
| 2017 | $1,116 | $47,800 | $22,400 | $25,400 |
| 2016 | $1,116 | $47,830 | $22,400 | $25,430 |
| 2015 | $1,144 | $48,780 | $22,400 | $26,380 |
| 2014 | $1,154 | $48,610 | $22,400 | $26,210 |
Source: Public Records
Map
Nearby Homes
Your Personal Tour Guide
Ask me questions while you tour the home.