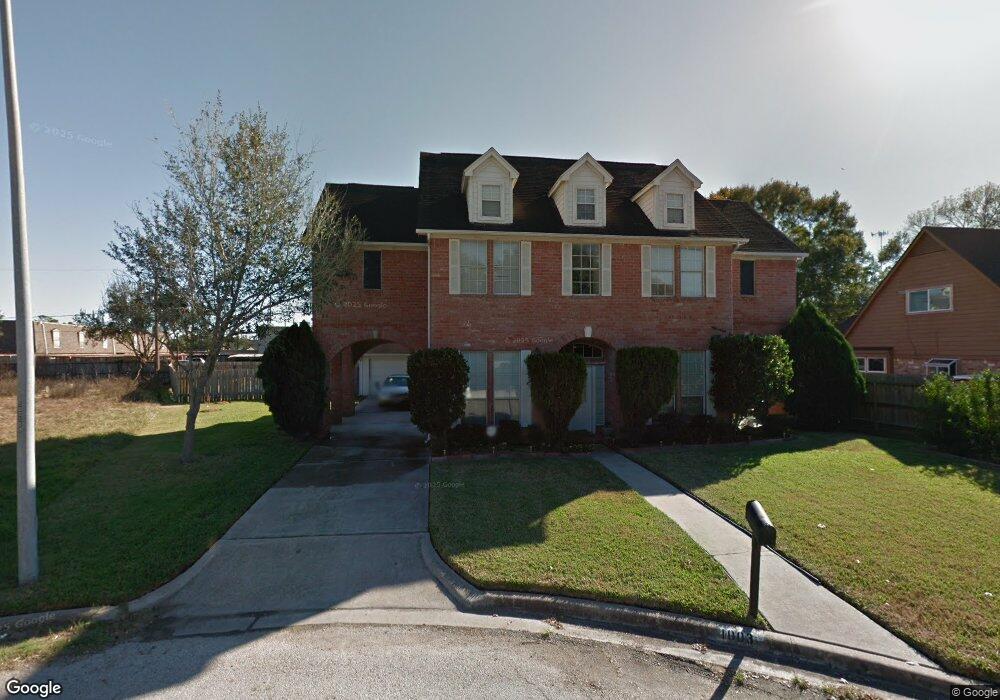
1003 Bonham Cir Richmond, TX 77469
Estimated Value: $252,000 - $385,000
4
Beds
3
Baths
2,920
Sq Ft
$116/Sq Ft
Est. Value
About This Home
This home is located at 1003 Bonham Cir, Richmond, TX 77469 and is currently estimated at $339,998, approximately $116 per square foot. 1003 Bonham Cir is a home located in Fort Bend County with nearby schools including Jane Long Elementary School, J J Wessendorff Middle School, and Lamar Junior High School.
Ownership History
Date
Name
Owned For
Owner Type
Purchase Details
Closed on
May 11, 2006
Sold by
Va
Bought by
Green Lonnie and Green Rhonda
Current Estimated Value
Home Financials for this Owner
Home Financials are based on the most recent Mortgage that was taken out on this home.
Original Mortgage
$118,720
Outstanding Balance
$68,758
Interest Rate
6.4%
Mortgage Type
Fannie Mae Freddie Mac
Estimated Equity
$271,240
Purchase Details
Closed on
Jul 11, 2005
Sold by
Mortgage Electronic Registration Systems
Bought by
Va
Purchase Details
Closed on
Jul 5, 2005
Sold by
Butler Dewitt Howell and Butler Mary Elizabeth
Bought by
Mortgage Electronic Registration Systems
Purchase Details
Closed on
Sep 4, 2002
Sold by
Pina Hector and Pina Gloria
Bought by
Butler Dewitt Howell and Butler Mary Elizabeth
Home Financials for this Owner
Home Financials are based on the most recent Mortgage that was taken out on this home.
Original Mortgage
$160,650
Interest Rate
6.41%
Mortgage Type
VA
Create a Home Valuation Report for This Property
The Home Valuation Report is an in-depth analysis detailing your home's value as well as a comparison with similar homes in the area
Home Values in the Area
Average Home Value in this Area
Purchase History
| Date | Buyer | Sale Price | Title Company |
|---|---|---|---|
| Green Lonnie | -- | None Available | |
| Va | -- | -- | |
| Mortgage Electronic Registration Systems | $127,789 | -- | |
| Green Lonnie | -- | -- | |
| Butler Dewitt Howell | -- | American Title Co |
Source: Public Records
Mortgage History
| Date | Status | Borrower | Loan Amount |
|---|---|---|---|
| Open | Green Lonnie | $118,720 | |
| Previous Owner | Butler Dewitt Howell | $160,650 |
Source: Public Records
Tax History Compared to Growth
Tax History
| Year | Tax Paid | Tax Assessment Tax Assessment Total Assessment is a certain percentage of the fair market value that is determined by local assessors to be the total taxable value of land and additions on the property. | Land | Improvement |
|---|---|---|---|---|
| 2025 | $3,472 | $285,966 | $26,000 | $334,217 |
| 2024 | $3,472 | $259,969 | -- | $336,157 |
| 2023 | $3,302 | $236,335 | $0 | $340,994 |
| 2022 | $4,332 | $214,850 | $0 | $320,900 |
| 2021 | $4,638 | $195,320 | $20,000 | $175,320 |
| 2020 | $4,721 | $195,900 | $20,000 | $175,900 |
| 2019 | $4,883 | $191,180 | $20,000 | $171,180 |
| 2018 | $4,798 | $186,780 | $20,000 | $166,780 |
| 2017 | $4,576 | $176,050 | $20,000 | $156,050 |
| 2016 | $4,581 | $176,250 | $20,000 | $156,250 |
| 2015 | $4,340 | $184,980 | $20,000 | $164,980 |
| 2014 | $4,388 | $179,830 | $20,000 | $159,830 |
Source: Public Records
Map
Nearby Homes
- 805 Chateau Place
- 2015 Tanglelane St
- 0 Meadow Ln
- 1004 Country Club Dr
- 0 Fm 2218 Unit 25550047
- 2001 Briar Ln
- 1922 Teakwood St
- 2236 Par Ln
- 406 Fairway Dr
- 24323 Rose Cobbler Dr
- 24351 Dyer Hill Way
- 1805 Hawthorn Dr
- 400 Hillcrest Dr
- 201 Hillcrest Dr
- 24331 Dyer Hill Way
- 1809 Hawthorn Dr
- 7315 Audubon Russet Dr
- 7322 Audubon Russet Dr
- 2143 Alabaster Estate Dr
- 1810 Winston Store Loop
- 1007 Bonham Cir
- 910 Bonham Cir
- 2111 Thompson Rd
- 1000 Bonham Cir
- 1002 Bonham Cir
- 1004 Bonham Cir
- 18206 Bonham Cir
- 1101 Long Dr
- 20626 Long Dr
- 20639 Long Dr
- 20622 Long Dr Unit TRACE
- 20627 Long Dr Unit TRACE
- 2100 Dowling Dr
- 2015 Thompson Rd
- 2010 Dowling Dr
- 2018 Thompson Rd
- 1105 Long Dr
- 726 Chestnut Ln
- 2008 Dowling Dr
- 1106 Long Dr