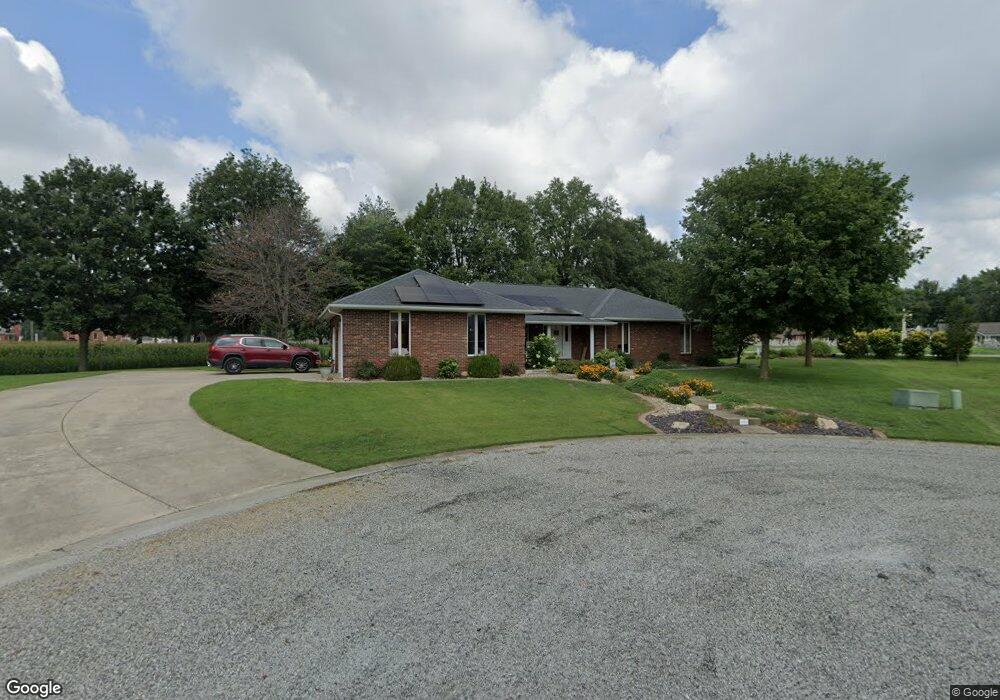
1003 Cherry St Bartelso, IL 62218
Estimated Value: $221,000 - $275,000
Studio
--
Bath
1,521
Sq Ft
$162/Sq Ft
Est. Value
About This Home
This home is located at 1003 Cherry St, Bartelso, IL 62218 and is currently estimated at $246,549, approximately $162 per square foot. 1003 Cherry St is a home located in Clinton County with nearby schools including Bartelso Elementary School and Central Community High School.
Ownership History
Date
Name
Owned For
Owner Type
Purchase Details
Closed on
Jan 16, 2009
Sold by
Trame Floyd and Trame Denise
Bought by
Trame Floyd and Trame Denise
Current Estimated Value
Home Financials for this Owner
Home Financials are based on the most recent Mortgage that was taken out on this home.
Original Mortgage
$1,400,000
Interest Rate
5.44%
Mortgage Type
New Conventional
Create a Home Valuation Report for This Property
The Home Valuation Report is an in-depth analysis detailing your home's value as well as a comparison with similar homes in the area
Purchase History
| Date | Buyer | Sale Price | Title Company |
|---|---|---|---|
| Trame Floyd | -- | None Available |
Source: Public Records
Mortgage History
| Date | Status | Borrower | Loan Amount |
|---|---|---|---|
| Closed | Trame Floyd | $1,400,000 |
Source: Public Records
Tax History
| Year | Tax Paid | Tax Assessment Tax Assessment Total Assessment is a certain percentage of the fair market value that is determined by local assessors to be the total taxable value of land and additions on the property. | Land | Improvement |
|---|---|---|---|---|
| 2024 | $3,858 | $69,600 | $8,340 | $61,260 |
| 2023 | $3,858 | $66,280 | $7,940 | $58,340 |
| 2022 | $4,082 | $55,550 | $7,360 | $48,190 |
| 2021 | $3,459 | $53,420 | $7,080 | $46,340 |
| 2020 | $3,541 | $53,420 | $7,080 | $46,340 |
| 2019 | $3,511 | $53,420 | $7,080 | $46,340 |
| 2018 | $3,517 | $50,350 | $7,080 | $43,270 |
| 2017 | $3,583 | $50,350 | $7,080 | $43,270 |
| 2016 | $3,567 | $50,350 | $7,080 | $43,270 |
| 2015 | $2,974 | $50,350 | $7,080 | $43,270 |
| 2013 | $2,974 | $50,650 | $6,160 | $44,490 |
Source: Public Records
Map
Nearby Homes
- 1102 Cherry St
- 5957 State Route 161
- 0 Redwood St
- 270 Locust St
- 9775 Dogwood Dr
- 904 Sycamore St
- 654 S 7th St
- 363 S Walnut St
- 1031 N 1st St
- 10520 Vonder Haar Ln
- 320 N Oak St
- 534 S 2nd St
- 889 N 1st St
- 210 N Elm St
- 265 N 1st St
- 337 N 2nd St
- 16617 Pembrooke Ct
- 655 N 8th St
- 16743 Ashland Ct
- 0 Kaskaskia River
- 1005 Cherry St
- 1004 Cherry St
- 13100 Gerdes Hill Ln
- 13105 Gerdes Hill Ln
- 205 Walnut St
- 10120 Illinois 161
- 207 Walnut St
- 1001 Cherry St
- 13065 Gerdes Hill Ln
- 1005 Carlyle Rd
- 912 Carlyle Rd
- 1009 Carlyle Rd
- 1003 Carlyle Rd
- 1001 Carlyle Rd
- 915 Carlyle Rd
- 1007 Carlyle Rd
- 1011 Carlyle Rd
- 254 Po Box
- 111 Po Box
- 1104 Cherry St
Your Personal Tour Guide
Ask me questions while you tour the home.