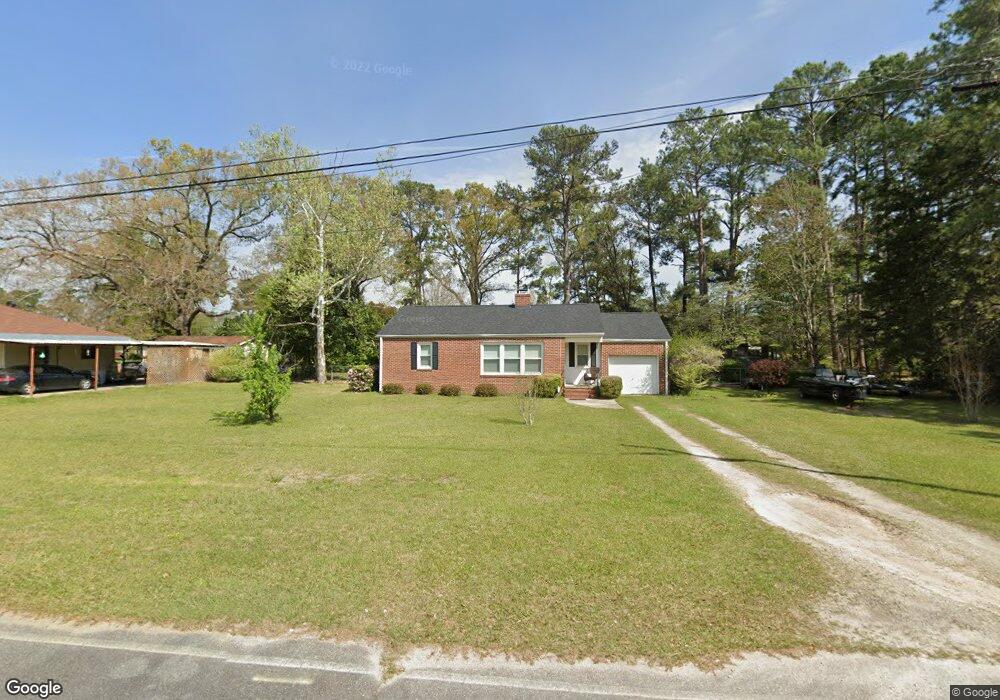
1003 E 4th Ave Cordele, GA 31015
Estimated Value: $52,000 - $129,000
2
Beds
1
Bath
1,096
Sq Ft
$87/Sq Ft
Est. Value
About This Home
This home is located at 1003 E 4th Ave, Cordele, GA 31015 and is currently estimated at $95,159, approximately $86 per square foot. 1003 E 4th Ave is a home located in Crisp County with nearby schools including Crisp County Elementary School, Crisp County Primary School, and Crisp County Middle School.
Ownership History
Date
Name
Owned For
Owner Type
Purchase Details
Closed on
Oct 7, 2025
Sold by
Monroe Allen Bura
Bought by
Quicken Loans Inc and Rocket Mortgage Llc
Current Estimated Value
Purchase Details
Closed on
May 20, 2016
Sold by
Johnson Danyal
Bought by
Allen Bura Monroe
Home Financials for this Owner
Home Financials are based on the most recent Mortgage that was taken out on this home.
Original Mortgage
$52,929
Interest Rate
3.59%
Mortgage Type
Commercial
Purchase Details
Closed on
Jan 1, 2015
Sold by
Johnson Danyal
Bought by
Johnson Danyal
Purchase Details
Closed on
Nov 19, 2004
Sold by
Wilson Lesley R
Bought by
Johnson Danyal
Purchase Details
Closed on
Jun 21, 2002
Sold by
Ward Edward and Ward Janice
Bought by
Wilson Lesley R
Purchase Details
Closed on
May 13, 1975
Bought by
Ward Edward and Ward Janice
Purchase Details
Closed on
Nov 7, 1967
Bought by
Ward Ward W and Ward Lucille
Create a Home Valuation Report for This Property
The Home Valuation Report is an in-depth analysis detailing your home's value as well as a comparison with similar homes in the area
Purchase History
| Date | Buyer | Sale Price | Title Company |
|---|---|---|---|
| Quicken Loans Inc | $51,100 | -- | |
| Allen Bura Monroe | $55,000 | -- | |
| Johnson Danyal | $55,000 | -- | |
| Johnson Danyal | $67,500 | -- | |
| Wilson Lesley R | $55,000 | -- | |
| Ward Edward | -- | -- | |
| Ward Ward W | -- | -- |
Source: Public Records
Mortgage History
| Date | Status | Borrower | Loan Amount |
|---|---|---|---|
| Previous Owner | Allen Bura Monroe | $52,929 |
Source: Public Records
Tax History
| Year | Tax Paid | Tax Assessment Tax Assessment Total Assessment is a certain percentage of the fair market value that is determined by local assessors to be the total taxable value of land and additions on the property. | Land | Improvement |
|---|---|---|---|---|
| 2025 | $1,259 | $35,701 | $6,621 | $29,080 |
| 2024 | $1,185 | $33,056 | $6,621 | $26,435 |
| 2023 | $1,067 | $28,454 | $3,310 | $25,144 |
| 2022 | $717 | $27,132 | $3,310 | $23,822 |
| 2021 | $703 | $25,809 | $3,310 | $22,499 |
| 2020 | $726 | $25,809 | $3,310 | $22,499 |
| 2019 | $732 | $25,809 | $3,310 | $22,499 |
| 2018 | $686 | $23,282 | $4,966 | $18,316 |
| 2017 | $945 | $23,282 | $4,966 | $18,316 |
| 2016 | $688 | $23,282 | $4,966 | $18,316 |
| 2015 | -- | $23,282 | $4,966 | $18,316 |
| 2014 | -- | $23,282 | $4,966 | $18,316 |
| 2013 | -- | $23,282 | $4,966 | $18,316 |
Source: Public Records
Map
Nearby Homes
- 703 N Pecan St
- 824 E 3rd Ave
- 405 N Bay St
- 1102 N 3rd St
- 413 E 2nd Ave
- 807 E 14th Ave
- 612 E 12th Ave
- 812 E 14th Ave
- 511 E 13th Ave
- 315 E 12th Ave
- 715 E 17th Ave
- 709 Fleming Rd
- 2413 S Ga 41 Hwy
- 312 E 14th Ave
- 716 E 18th Ave
- 1002 Camellia Dr
- 720 E 20th Ave
- 1012 E 21st Ave
- 1509 E 20th Ave
- 1001 Stewart Ave
Your Personal Tour Guide
Ask me questions while you tour the home.