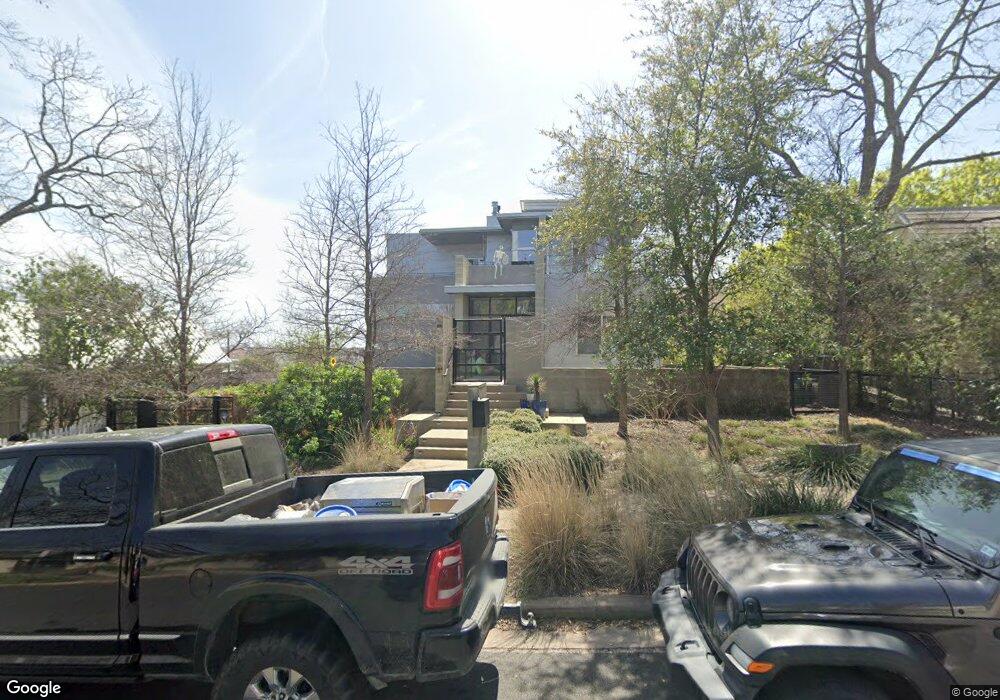
1003 E 8th St Unit B Austin, TX 78702
East Austin NeighborhoodEstimated Value: $1,143,000 - $1,988,000
1
Bed
1
Bath
650
Sq Ft
$2,368/Sq Ft
Est. Value
About This Home
This home is located at 1003 E 8th St Unit B, Austin, TX 78702 and is currently estimated at $1,539,434, approximately $2,368 per square foot. 1003 E 8th St Unit B is a home located in Travis County with nearby schools including Mathews Elementary School, Austin High School, and University of Texas Elementary School.
Ownership History
Date
Name
Owned For
Owner Type
Purchase Details
Closed on
Jan 8, 2026
Sold by
Love Sharon E
Bought by
1003 East 8Th Street Revocable Trust and Love
Current Estimated Value
Home Financials for this Owner
Home Financials are based on the most recent Mortgage that was taken out on this home.
Original Mortgage
$1,836,000
Outstanding Balance
$1,836,000
Interest Rate
6.23%
Mortgage Type
Seller Take Back
Estimated Equity
-$296,566
Purchase Details
Closed on
Jun 24, 2022
Sold by
Kull Andrew and Kull Dana
Bought by
Love Sharon E
Purchase Details
Closed on
Jul 8, 2014
Sold by
Saskia Llc
Bought by
Kull Andrew and Kull Dana
Home Financials for this Owner
Home Financials are based on the most recent Mortgage that was taken out on this home.
Original Mortgage
$600,000
Interest Rate
2.87%
Mortgage Type
Adjustable Rate Mortgage/ARM
Purchase Details
Closed on
Jan 1, 2012
Sold by
Shapiro Saskia and Pushard Saskia Richter
Bought by
Saskia Llc
Purchase Details
Closed on
Mar 31, 2008
Sold by
Entrust Admin Inc
Bought by
Pushard Saskia Richter
Purchase Details
Closed on
Feb 6, 2008
Sold by
Pushard Earl Douglass
Bought by
Pushard Saskia Richter
Purchase Details
Closed on
Jan 17, 2007
Sold by
Pushard Douglass
Bought by
Pushard Saskia
Purchase Details
Closed on
Sep 22, 2004
Sold by
Baldoza Juanita
Bought by
Entrust Admin Inc
Create a Home Valuation Report for This Property
The Home Valuation Report is an in-depth analysis detailing your home's value as well as a comparison with similar homes in the area
Home Values in the Area
Average Home Value in this Area
Purchase History
We collect this data history from publicly available records. To have your information removed, we recommend requesting removal directly through your county’s website.
| Date | Buyer | Sale Price | Title Company |
|---|---|---|---|
| 1003 East 8Th Street Revocable Trust | -- | None Listed On Document | |
| Love Sharon E | -- | Green Kirsten | |
| Kull Andrew | -- | None Available | |
| Saskia Llc | -- | None Available | |
| Pushard Saskia Richter | -- | None Available | |
| Pushard Saskia Richter | -- | None Available | |
| Pushard Saskia | -- | None Available | |
| Entrust Admin Inc | -- | -- |
Source: Public Records
Mortgage History
We collect this data history from publicly available records. To have your information removed, we recommend requesting removal directly through your county’s website.
| Date | Status | Borrower | Loan Amount |
|---|---|---|---|
| Open | 1003 East 8Th Street Revocable Trust | $1,836,000 | |
| Previous Owner | Kull Andrew | $600,000 |
Source: Public Records
Tax History
| Year | Tax Paid | Tax Assessment Tax Assessment Total Assessment is a certain percentage of the fair market value that is determined by local assessors to be the total taxable value of land and additions on the property. | Land | Improvement |
|---|---|---|---|---|
| 2025 | $30,830 | $1,514,078 | $473,105 | $1,040,973 |
| 2023 | $34,504 | $1,922,877 | $468,750 | $1,454,127 |
| 2022 | $14,615 | $1,078,117 | $0 | $0 |
| 2021 | $21,334 | $980,106 | $312,500 | $756,130 |
| 2020 | $19,111 | $891,005 | $312,500 | $578,505 |
| 2018 | $19,122 | $863,691 | $312,500 | $551,191 |
| 2017 | $18,409 | $825,447 | $260,000 | $632,379 |
| 2016 | $16,735 | $750,406 | $234,000 | $650,569 |
| 2015 | $13,469 | $682,187 | $195,000 | $530,694 |
| 2014 | $13,469 | $620,170 | $195,000 | $425,170 |
Source: Public Records
Map
Nearby Homes
- 1007 E 8th St
- 800 Embassy Dr Unit 113
- 800 Embassy Dr Unit 605
- 800 Embassy Dr Unit 413
- 800 Embassy Dr Unit 236
- 800 Embassy Dr Unit 337
- 1305 E 6th St Unit 13
- 1023 Juniper St
- 2014 E 10th St
- 507 Sabine St Unit 605
- 507 Sabine St Unit 509
- 1105 E 3rd St
- 1202 Hackberry St
- 1192 B Comal St
- 1150 San Bernard St Unit 1
- 1184 Waller St
- 205 Medina St Unit 1
- 1175 Navasota St Unit 2
- 303 Navasota St
- 555 E 5th St Unit 911
- 1001 E 8th St
- 719 San Marcos St
- 1005 E 8th St
- 1000 E 8th St
- 1004 E 7th St
- 1006 E 8th St
- 1006 E 8th St Unit A
- 809B San Marcos St
- 809 San Marcos St
- 1006 E 7th St
- 1008 E 8th St
- 1010 E 8th St
- 1009 E 8th St
- 1008 E 7th St
- 811 San Marcos St
- 1012 E 8th St
- 1012 E 8th St Unit 1
- 1012 E 8th St Unit 2
- 1005 E 9th St
- 1007 E 9th St
Your Personal Tour Guide
Ask me questions while you tour the home.