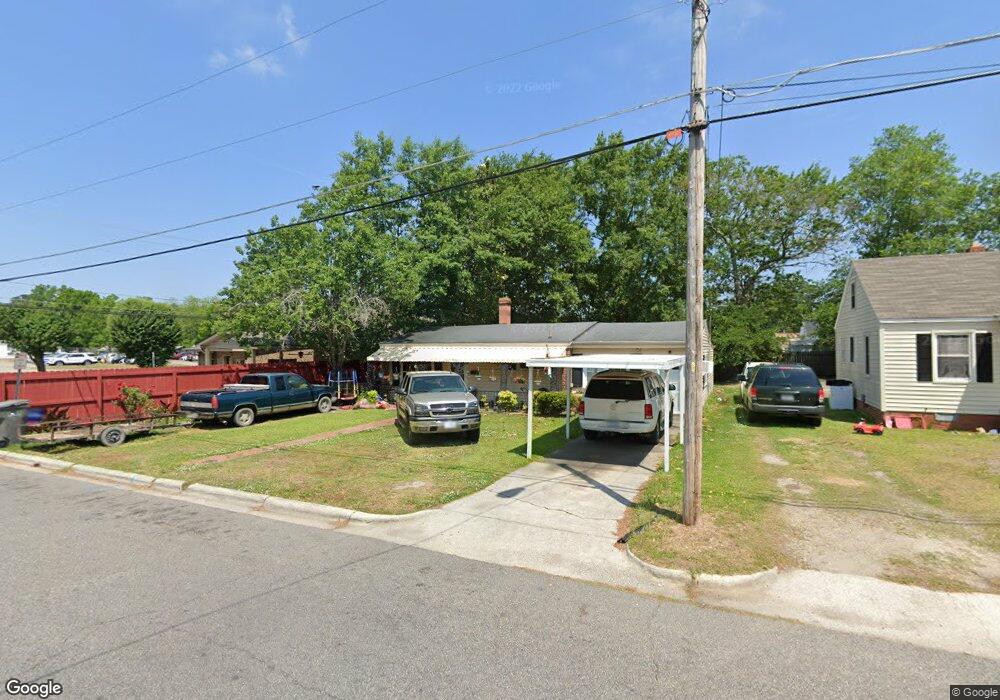
1003 E 9th St Lumberton, NC 28358
Estimated Value: $131,000 - $150,000
2
Beds
1
Bath
1,270
Sq Ft
$113/Sq Ft
Est. Value
About This Home
This home is located at 1003 E 9th St, Lumberton, NC 28358 and is currently estimated at $143,923, approximately $113 per square foot. 1003 E 9th St is a home located in Robeson County with nearby schools including Rowland Norment Elementary School, Parkton Elementary School, and L. Gilbert Carroll Middle School.
Ownership History
Date
Name
Owned For
Owner Type
Purchase Details
Closed on
Aug 24, 2015
Sold by
Valade John F and Valade Donna S
Bought by
Hammonds Jw and Hammonds Resa
Current Estimated Value
Purchase Details
Closed on
Oct 6, 2005
Sold by
Stark Martin and Stark Kimberly
Bought by
Valade John F and Valade Donna S
Home Financials for this Owner
Home Financials are based on the most recent Mortgage that was taken out on this home.
Original Mortgage
$74,375
Interest Rate
5.72%
Mortgage Type
Purchase Money Mortgage
Purchase Details
Closed on
Sep 13, 2005
Sold by
Shaw Betty and Williams Bobby
Bought by
Stark Martin and Stark Kimberly D
Home Financials for this Owner
Home Financials are based on the most recent Mortgage that was taken out on this home.
Original Mortgage
$74,375
Interest Rate
5.72%
Mortgage Type
Purchase Money Mortgage
Create a Home Valuation Report for This Property
The Home Valuation Report is an in-depth analysis detailing your home's value as well as a comparison with similar homes in the area
Purchase History
| Date | Buyer | Sale Price | Title Company |
|---|---|---|---|
| Hammonds Jw | -- | Attorney | |
| Valade John F | $87,500 | -- | |
| Stark Martin | $77,500 | -- |
Source: Public Records
Mortgage History
| Date | Status | Borrower | Loan Amount |
|---|---|---|---|
| Previous Owner | Valade John F | $74,375 |
Source: Public Records
Tax History
| Year | Tax Paid | Tax Assessment Tax Assessment Total Assessment is a certain percentage of the fair market value that is determined by local assessors to be the total taxable value of land and additions on the property. | Land | Improvement |
|---|---|---|---|---|
| 2025 | $1,192 | $137,600 | $11,000 | $126,600 |
| 2024 | $1,182 | $137,600 | $11,000 | $126,600 |
| 2023 | $855 | $93,800 | $10,000 | $83,800 |
| 2022 | $855 | $93,800 | $10,000 | $83,800 |
| 2021 | $855 | $93,800 | $10,000 | $83,800 |
| 2020 | $825 | $93,800 | $10,000 | $83,800 |
| 2018 | $842 | $59,200 | $12,000 | $47,200 |
| 2017 | $730 | $59,200 | $12,000 | $47,200 |
| 2016 | $730 | $59,200 | $12,000 | $47,200 |
| 2015 | $730 | $59,200 | $12,000 | $47,200 |
| 2014 | $730 | $59,200 | $12,000 | $47,200 |
Source: Public Records
Map
Nearby Homes
Your Personal Tour Guide
Ask me questions while you tour the home.