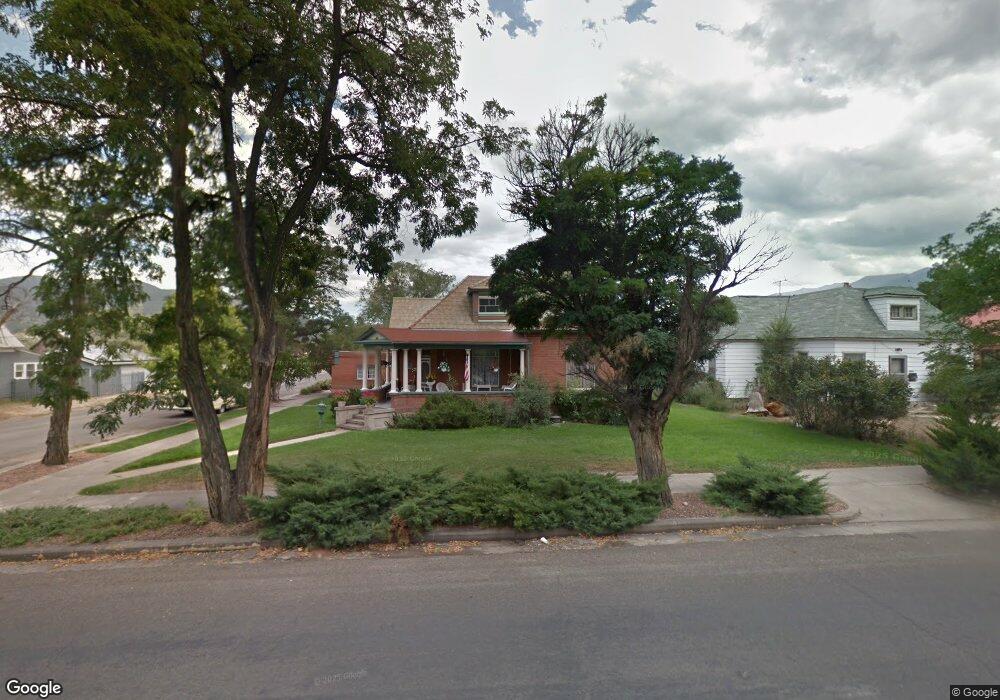
1003 F St Salida, CO 81201
Estimated Value: $709,000 - $1,001,000
2
Beds
1
Bath
1,319
Sq Ft
$615/Sq Ft
Est. Value
About This Home
This home is located at 1003 F St, Salida, CO 81201 and is currently estimated at $811,207, approximately $615 per square foot. 1003 F St is a home located in Chaffee County with nearby schools including Longfellow Elementary School, Salida Middle School, and Horizons Exploratory Academy.
Ownership History
Date
Name
Owned For
Owner Type
Purchase Details
Closed on
Aug 16, 2021
Sold by
Tailwind Group Llc
Bought by
Isaacson Gregary L and Isaacson Sarah B
Current Estimated Value
Home Financials for this Owner
Home Financials are based on the most recent Mortgage that was taken out on this home.
Original Mortgage
$322,500
Outstanding Balance
$293,252
Interest Rate
2.9%
Mortgage Type
New Conventional
Estimated Equity
$517,955
Purchase Details
Closed on
Apr 17, 2000
Bought by
Cobb Jeffrey W and Mackenzie Marlayna S
Create a Home Valuation Report for This Property
The Home Valuation Report is an in-depth analysis detailing your home's value as well as a comparison with similar homes in the area
Home Values in the Area
Average Home Value in this Area
Purchase History
| Date | Buyer | Sale Price | Title Company |
|---|---|---|---|
| Isaacson Gregary L | $430,000 | None Available | |
| Cobb Jeffrey W | $189,900 | -- |
Source: Public Records
Mortgage History
| Date | Status | Borrower | Loan Amount |
|---|---|---|---|
| Open | Isaacson Gregary L | $322,500 |
Source: Public Records
Tax History Compared to Growth
Tax History
| Year | Tax Paid | Tax Assessment Tax Assessment Total Assessment is a certain percentage of the fair market value that is determined by local assessors to be the total taxable value of land and additions on the property. | Land | Improvement |
|---|---|---|---|---|
| 2024 | $1,915 | $57,020 | $29,040 | $27,980 |
| 2023 | $1,852 | $57,020 | $29,040 | $27,980 |
| 2022 | $1,546 | $43,720 | $22,600 | $21,120 |
| 2021 | $1,551 | $44,990 | $23,260 | $21,730 |
| 2020 | $1,336 | $32,750 | $10,900 | $21,850 |
| 2019 | $1,338 | $32,750 | $10,900 | $21,850 |
| 2018 | $1,108 | $22,920 | $5,390 | $17,530 |
| 2017 | $1,080 | $22,920 | $5,390 | $17,530 |
| 2016 | $1,005 | $20,890 | $7,440 | $13,450 |
| 2015 | $1,347 | $20,890 | $7,440 | $13,450 |
| 2014 | $1,347 | $26,660 | $0 | $0 |
Source: Public Records
Map
Nearby Homes