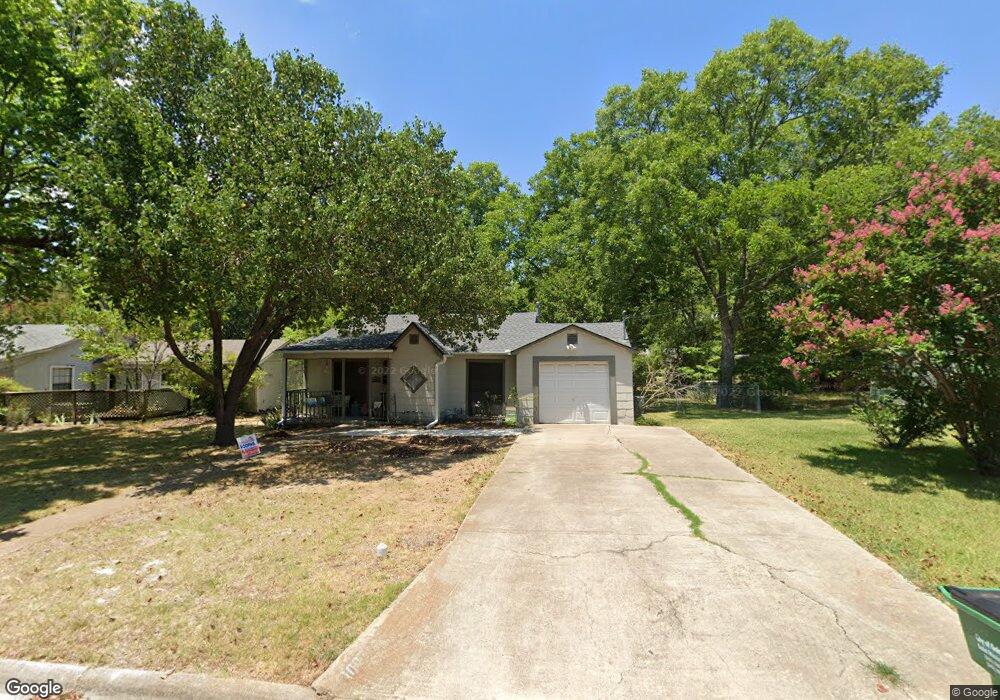
1003 Gladney St Gainesville, TX 76240
Estimated Value: $168,977 - $173,000
3
Beds
1
Bath
1,108
Sq Ft
$155/Sq Ft
Est. Value
About This Home
This home is located at 1003 Gladney St, Gainesville, TX 76240 and is currently estimated at $171,326, approximately $154 per square foot. 1003 Gladney St is a home located in Cooke County with nearby schools including Edison Elementary School, W.E. Chalmers Elementary School, and Gainesville Intermediate School.
Ownership History
Date
Name
Owned For
Owner Type
Purchase Details
Closed on
May 9, 2017
Sold by
Eberhart Brandon and Eberhart Aubrey
Bought by
Payton Sarah
Current Estimated Value
Home Financials for this Owner
Home Financials are based on the most recent Mortgage that was taken out on this home.
Original Mortgage
$63,920
Outstanding Balance
$52,962
Interest Rate
4.14%
Mortgage Type
New Conventional
Estimated Equity
$118,364
Purchase Details
Closed on
Nov 2, 2011
Sold by
Eberhart Rebecca J
Bought by
Eberhart Brandon M
Purchase Details
Closed on
Mar 31, 2009
Sold by
Williams John Wiley and Wiliams Thomas Felix
Bought by
Eberhart Brandon and Eberhart Rebecca
Home Financials for this Owner
Home Financials are based on the most recent Mortgage that was taken out on this home.
Original Mortgage
$59,489
Interest Rate
5.21%
Mortgage Type
New Conventional
Create a Home Valuation Report for This Property
The Home Valuation Report is an in-depth analysis detailing your home's value as well as a comparison with similar homes in the area
Purchase History
| Date | Buyer | Sale Price | Title Company |
|---|---|---|---|
| Payton Sarah | -- | None Available | |
| Eberhart Brandon M | -- | None Available | |
| Eberhart Brandon | -- | -- |
Source: Public Records
Mortgage History
| Date | Status | Borrower | Loan Amount |
|---|---|---|---|
| Open | Payton Sarah | $63,920 | |
| Previous Owner | Eberhart Brandon | $59,489 |
Source: Public Records
Tax History
| Year | Tax Paid | Tax Assessment Tax Assessment Total Assessment is a certain percentage of the fair market value that is determined by local assessors to be the total taxable value of land and additions on the property. | Land | Improvement |
|---|---|---|---|---|
| 2025 | $2,901 | $153,071 | $37,037 | $116,034 |
| 2024 | $2,901 | $153,071 | $37,037 | $116,034 |
| 2023 | $3,002 | $152,999 | $33,670 | $119,329 |
| 2022 | $3,163 | $145,312 | $30,030 | $115,282 |
| 2021 | $2,795 | $108,537 | $20,020 | $88,517 |
| 2020 | $2,559 | $96,359 | $19,110 | $77,249 |
| 2019 | $2,330 | $85,264 | $19,110 | $66,154 |
| 2018 | $1,907 | $69,865 | $9,555 | $60,310 |
| 2017 | $1,338 | $49,224 | $9,555 | $39,669 |
| 2015 | $1,087 | $48,071 | $9,555 | $38,516 |
| 2014 | $1,087 | $48,071 | $9,555 | $38,516 |
Source: Public Records
Map
Nearby Homes
- 1016 N Howeth St
- 1015 N Howeth St
- 1102 Fair Ave
- 912 Ritchey St
- 1113 Fair Ave
- 924 N Clements St
- 705 Fair Ave
- 811 Ritchey St
- 805 Ritchey St
- 720 Myrtle St
- 802 Myrtle St
- 00 O'Neal St
- 707 Ritchey St
- 1305 Hillcrest Blvd
- 1204 Elmwood St
- 901 N Morris St
- 608 Ritchey St
- 2005 Brentwood St
- 2002 Everglade Dr
- TBD County Road 208
- 1001 Gladney St
- 1005 Gladney St
- 1004 N Howeth St
- 1002 N Howeth St
- 1000 N Howeth St
- 1006 N Howeth St
- 1004 Gladney St
- 927 Gladney St
- 1009 Gladney St
- 1002 Gladney St
- 1002 Gladney St
- 1000 Gladney St
- 930 N Howeth St
- 1006 Gladney St
- 1011 Gladney St
- 1012 N Howeth St
- 1008 Gladney St
- 907 Gladney St
- 920 N Howeth St
- 1005 N Howeth St
Your Personal Tour Guide
Ask me questions while you tour the home.