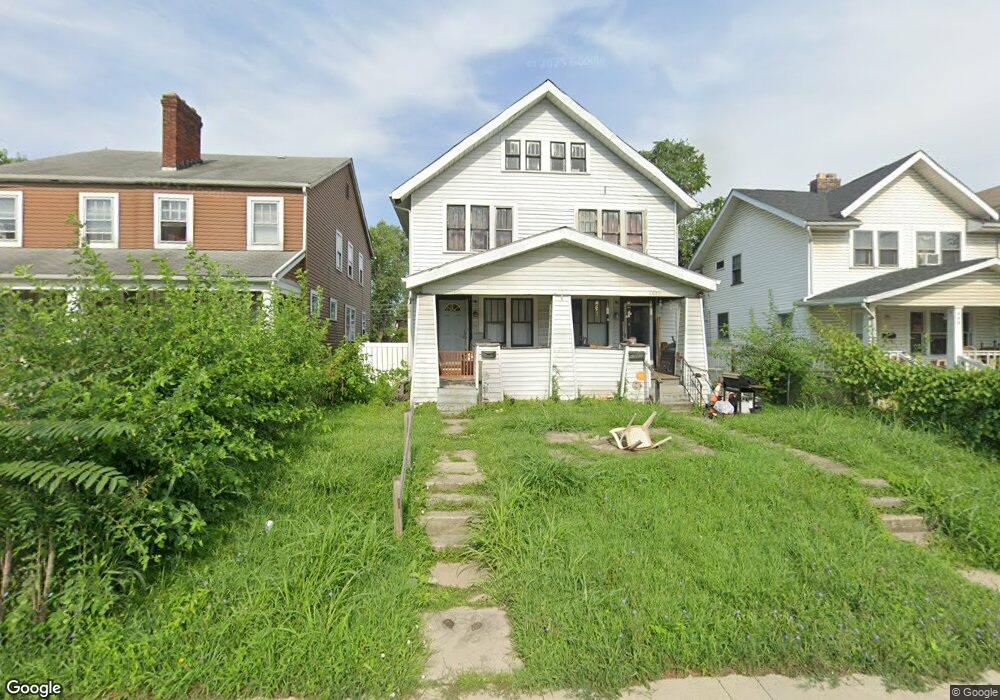
1003 Lockbourne Rd Unit 5 Columbus, OH 43206
Driving Park NeighborhoodEstimated Value: $267,602 - $362,000
6
Beds
2
Baths
2,520
Sq Ft
$127/Sq Ft
Est. Value
About This Home
This home is located at 1003 Lockbourne Rd Unit 5, Columbus, OH 43206 and is currently estimated at $320,401, approximately $127 per square foot. 1003 Lockbourne Rd Unit 5 is a home located in Franklin County with nearby schools including Livingston Elementary School, South High School, and Capital Collegiate Preparatory Academy.
Ownership History
Date
Name
Owned For
Owner Type
Purchase Details
Closed on
Jul 23, 2010
Sold by
Provens David and Provens Kelly
Bought by
24 Ct Real Estate Llc
Current Estimated Value
Purchase Details
Closed on
May 21, 2007
Sold by
Deutsche Bank National Trust Co
Bought by
Provens David and Provens Kelly
Purchase Details
Closed on
Feb 13, 2007
Sold by
Green Donald F
Bought by
Deutsche Bank National Trust Co and Long Beach Mortgage Loan Trust 2006-2
Purchase Details
Closed on
Jan 6, 2006
Sold by
Dfg2 Llc
Bought by
Green Donald F
Home Financials for this Owner
Home Financials are based on the most recent Mortgage that was taken out on this home.
Original Mortgage
$60,000
Interest Rate
10.65%
Mortgage Type
Fannie Mae Freddie Mac
Purchase Details
Closed on
Apr 29, 2005
Sold by
Patterson Dana Eugene and Patterson Ricky L
Bought by
Dfg2 Llc
Purchase Details
Closed on
May 1, 1987
Create a Home Valuation Report for This Property
The Home Valuation Report is an in-depth analysis detailing your home's value as well as a comparison with similar homes in the area
Home Values in the Area
Average Home Value in this Area
Purchase History
| Date | Buyer | Sale Price | Title Company |
|---|---|---|---|
| 24 Ct Real Estate Llc | -- | Real Living | |
| Provens David | $17,000 | Resource | |
| Deutsche Bank National Trust Co | $17,000 | Resource T | |
| Green Donald F | -- | Kendra Titl | |
| Dfg2 Llc | $25,000 | Gahanna | |
| -- | -- | -- |
Source: Public Records
Mortgage History
| Date | Status | Borrower | Loan Amount |
|---|---|---|---|
| Previous Owner | Green Donald F | $60,000 |
Source: Public Records
Tax History Compared to Growth
Tax History
| Year | Tax Paid | Tax Assessment Tax Assessment Total Assessment is a certain percentage of the fair market value that is determined by local assessors to be the total taxable value of land and additions on the property. | Land | Improvement |
|---|---|---|---|---|
| 2024 | $2,887 | $63,000 | $30,870 | $32,130 |
| 2023 | $3,326 | $73,500 | $30,870 | $42,630 |
| 2022 | $1,070 | $20,130 | $6,720 | $13,410 |
| 2021 | $1,072 | $20,130 | $6,720 | $13,410 |
| 2020 | $1,152 | $21,600 | $6,720 | $14,880 |
| 2019 | $1,034 | $16,630 | $5,180 | $11,450 |
| 2018 | $761 | $16,630 | $5,180 | $11,450 |
| 2017 | $886 | $16,630 | $5,180 | $11,450 |
| 2016 | $738 | $10,860 | $4,590 | $6,270 |
| 2015 | $580 | $10,860 | $4,590 | $6,270 |
| 2014 | $717 | $10,860 | $4,590 | $6,270 |
| 2013 | $354 | $11,550 | $4,585 | $6,965 |
Source: Public Records
Map
Nearby Homes
- 1025 Lockbourne Rd Unit 27
- 1005 Studer Ave
- 1021-1023 Miller Ave
- 993 Miller Ave Unit 995
- 954 Miller Ave
- 980 Miller Ave
- 1060-1062 Linwood Ave
- 1144 E Whittier St
- 1337 E Kossuth St Unit 1339
- 1107 Stanley Ave
- 928 Miller Ave
- 911 Linwood Ave Unit & 913
- 901 Miller Ave
- 1045 Wilson Ave Unit 47
- 959 Kelton Ave
- 1100 Wilson Ave Unit 1100
- 855 Studer Ave
- 851 Studer Ave
- 910 Ellsworth Ave
- 991 Lilley Ave
- 1003-1005 Lockbourne Rd
- 1011 Lockbourne Rd Unit 13
- 999 Lockbourne Rd
- 1231-1235 E Columbus St
- 1231 E Columbus St Unit 235
- 995 Lockbourne Rd
- 1015 Lockbourne Rd Unit 17
- 1019 Lockbourne Rd
- 1006 Lockbourne Rd
- 985 Lockbourne Rd
- 1025-1027 Lockbourne Rd
- 996 Studer Ave
- 1000 Studer Ave
- 986-992 Studer Ave
- 1004 Studer Ave
- 979-981 Lockbourne Rd
- 979 Lockbourne Rd Unit 981
- 1024 Lockbourne Rd Unit 1024
- 1002 Lockbourne Rd
- 986 Studer Ave Unit IT feels like home