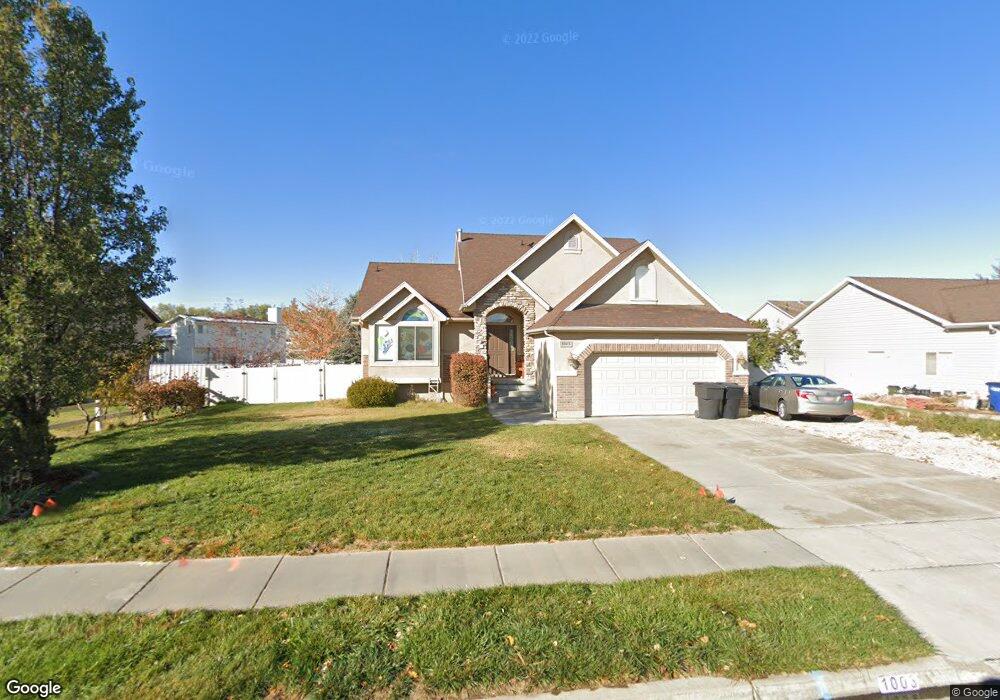
1003 N 780 W Clearfield, UT 84015
Estimated Value: $608,000 - $639,475
7
Beds
4
Baths
3,692
Sq Ft
$170/Sq Ft
Est. Value
About This Home
This home is located at 1003 N 780 W, Clearfield, UT 84015 and is currently estimated at $628,369, approximately $170 per square foot. 1003 N 780 W is a home located in Davis County with nearby schools including Clinton Elementary School, Sunset Junior High School, and Clearfield High School.
Ownership History
Date
Name
Owned For
Owner Type
Purchase Details
Closed on
Nov 30, 2020
Sold by
Brocious Jesse and Brocious Lacey Marie
Bought by
Brocious Jesse David and Brocious Lacey Marie
Current Estimated Value
Home Financials for this Owner
Home Financials are based on the most recent Mortgage that was taken out on this home.
Original Mortgage
$326,930
Outstanding Balance
$290,921
Interest Rate
2.8%
Mortgage Type
New Conventional
Estimated Equity
$337,448
Purchase Details
Closed on
Feb 27, 2020
Sold by
Brocious Jesse
Bought by
Brocious Jesse and Brocious Lacey Marie
Home Financials for this Owner
Home Financials are based on the most recent Mortgage that was taken out on this home.
Original Mortgage
$325,600
Interest Rate
3.6%
Mortgage Type
New Conventional
Purchase Details
Closed on
May 2, 2018
Sold by
Gunter Lorald A and Gunter Natalie L
Bought by
Gunter Lorald Allen and Gunter Family Living Trust
Purchase Details
Closed on
Oct 18, 2004
Sold by
Wind River Homes Inc
Bought by
Schultz Brenda K
Purchase Details
Closed on
Jun 2, 2004
Sold by
Freemont Investments Llc
Bought by
Wind River Homes Inc
Home Financials for this Owner
Home Financials are based on the most recent Mortgage that was taken out on this home.
Original Mortgage
$204,000
Interest Rate
5.92%
Mortgage Type
Purchase Money Mortgage
Purchase Details
Closed on
Jan 16, 2004
Sold by
Faerber David M
Bought by
Freemont Investments Llc
Home Financials for this Owner
Home Financials are based on the most recent Mortgage that was taken out on this home.
Original Mortgage
$200,000
Interest Rate
5.86%
Mortgage Type
Stand Alone Second
Purchase Details
Closed on
Jan 7, 2004
Sold by
Keepsake Development Llc
Bought by
Faerber David M and Vansweden James O
Home Financials for this Owner
Home Financials are based on the most recent Mortgage that was taken out on this home.
Original Mortgage
$200,000
Interest Rate
5.86%
Mortgage Type
Stand Alone Second
Create a Home Valuation Report for This Property
The Home Valuation Report is an in-depth analysis detailing your home's value as well as a comparison with similar homes in the area
Home Values in the Area
Average Home Value in this Area
Purchase History
| Date | Buyer | Sale Price | Title Company |
|---|---|---|---|
| Brocious Jesse David | -- | Title Guarantee | |
| Brocious Jesse | -- | Hickman Land Title Co | |
| Broclous Jesse | -- | First American Title | |
| Gunter Lorald Allen | -- | Monument Title | |
| Schultz Brenda K | -- | Bonneville Title Company Inc | |
| Wind River Homes Inc | -- | Bonneville Title Company Inc | |
| Freemont Investments Llc | -- | Bonneville Title Company Inc | |
| Freemont Investments Llc | -- | Bonneville Title Company Inc | |
| Faerber David M | -- | Bonneville Title Company Inc |
Source: Public Records
Mortgage History
| Date | Status | Borrower | Loan Amount |
|---|---|---|---|
| Open | Brocious Jesse David | $326,930 | |
| Closed | Brocious Jesse | $325,600 | |
| Previous Owner | Wind River Homes Inc | $204,000 | |
| Previous Owner | Freemont Investments Llc | $200,000 | |
| Previous Owner | Faerber David M | $900,000 |
Source: Public Records
Tax History Compared to Growth
Tax History
| Year | Tax Paid | Tax Assessment Tax Assessment Total Assessment is a certain percentage of the fair market value that is determined by local assessors to be the total taxable value of land and additions on the property. | Land | Improvement |
|---|---|---|---|---|
| 2025 | $3,478 | $334,400 | $88,773 | $245,627 |
| 2024 | $3,352 | $323,950 | $97,742 | $226,208 |
| 2023 | $3,165 | $566,000 | $110,923 | $455,077 |
| 2022 | $3,363 | $332,750 | $68,201 | $264,549 |
| 2021 | $3,012 | $442,000 | $84,789 | $357,211 |
| 2020 | $2,623 | $381,000 | $71,735 | $309,265 |
| 2019 | $2,481 | $352,000 | $84,406 | $267,594 |
| 2018 | $2,346 | $327,000 | $71,368 | $255,632 |
| 2016 | $2,119 | $152,570 | $27,726 | $124,844 |
| 2015 | $1,990 | $136,180 | $27,726 | $108,454 |
| 2014 | $1,858 | $129,212 | $27,726 | $101,486 |
| 2013 | -- | $119,936 | $27,143 | $92,793 |
Source: Public Records
Map
Nearby Homes
- 844 N 1000 W
- 1121 N 900 W
- 1038 W 800 N
- 652 W 800 N Unit 131
- 652 W 800 N Unit 62
- 984 N 1100 W
- 721 N 800 W
- 1214 N 700 W
- 690 Barlow St
- 1118 N 575 W
- 1242 W 1075 N
- 341 W 750 N
- 922 W 1420 N
- 1438 N 475 W
- 417 N 1200 W Unit 84
- 1337 W 550 N Unit 195
- 1122 N 1500 W
- 1463 N 1250 W
- 423 N 1250 W Unit 118
- 563 N 1350 W Unit 139