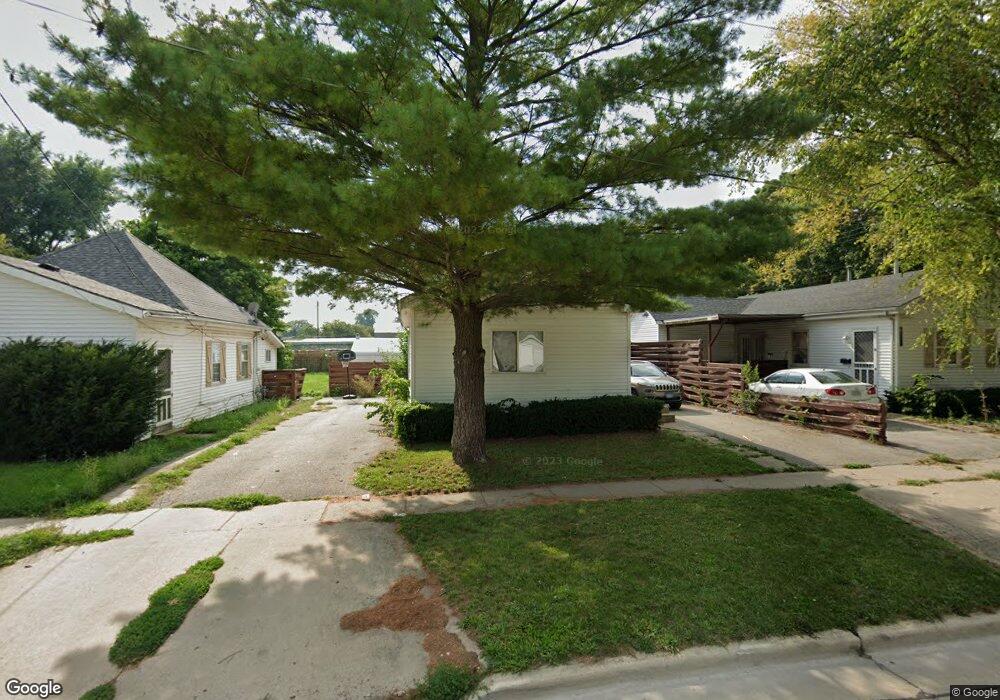
1003 N Elm St Champaign, IL 61820
Estimated Value: $243,000 - $300,000
3
Beds
1
Bath
850
Sq Ft
$322/Sq Ft
Est. Value
About This Home
This home is located at 1003 N Elm St, Champaign, IL 61820 and is currently estimated at $273,658, approximately $321 per square foot. 1003 N Elm St is a home located in Champaign County with nearby schools including Central High School, Judah Christian School, and Franklin STEAM Academy.
Ownership History
Date
Name
Owned For
Owner Type
Purchase Details
Closed on
Nov 15, 2022
Sold by
Dobsch Matthew D and Dobsch Lacey A
Bought by
Dougherty-Roberts Mary Margaret and Roberts Timothy George
Current Estimated Value
Purchase Details
Closed on
May 29, 2007
Sold by
Richmond Timothy Alan and Richmond Mindy Renee
Bought by
Dobsch Matthew D and Dobsch Lacey A
Home Financials for this Owner
Home Financials are based on the most recent Mortgage that was taken out on this home.
Original Mortgage
$123,256
Interest Rate
6.22%
Mortgage Type
Purchase Money Mortgage
Purchase Details
Closed on
Feb 27, 2004
Sold by
Gwinn Hazel P
Bought by
Richmond Timothy Alan and Richmond Mindy Renee
Home Financials for this Owner
Home Financials are based on the most recent Mortgage that was taken out on this home.
Original Mortgage
$76,400
Interest Rate
5.71%
Mortgage Type
Balloon
Create a Home Valuation Report for This Property
The Home Valuation Report is an in-depth analysis detailing your home's value as well as a comparison with similar homes in the area
Home Values in the Area
Average Home Value in this Area
Purchase History
| Date | Buyer | Sale Price | Title Company |
|---|---|---|---|
| Dougherty-Roberts Mary Margaret | $34,666 | None Listed On Document | |
| Dobsch Matthew D | $154,500 | None Available | |
| Richmond Timothy Alan | $95,500 | -- |
Source: Public Records
Mortgage History
| Date | Status | Borrower | Loan Amount |
|---|---|---|---|
| Previous Owner | Dobsch Matthew D | $123,256 | |
| Previous Owner | Richmond Timothy Alan | $76,400 |
Source: Public Records
Tax History Compared to Growth
Tax History
| Year | Tax Paid | Tax Assessment Tax Assessment Total Assessment is a certain percentage of the fair market value that is determined by local assessors to be the total taxable value of land and additions on the property. | Land | Improvement |
|---|---|---|---|---|
| 2024 | $3,598 | $55,890 | $25,200 | $30,690 |
| 2023 | $3,598 | $50,900 | $22,950 | $27,950 |
| 2022 | $3,766 | $46,950 | $21,170 | $25,780 |
| 2021 | $3,664 | $46,020 | $20,750 | $25,270 |
| 2020 | $3,507 | $44,250 | $19,950 | $24,300 |
| 2019 | $3,383 | $43,340 | $19,540 | $23,800 |
| 2018 | $3,299 | $42,660 | $19,230 | $23,430 |
| 2017 | $3,164 | $41,020 | $18,490 | $22,530 |
| 2016 | $2,827 | $40,180 | $18,110 | $22,070 |
| 2015 | $2,840 | $39,470 | $17,790 | $21,680 |
| 2014 | $2,743 | $39,470 | $17,790 | $21,680 |
| 2013 | $2,719 | $39,470 | $17,790 | $21,680 |
Source: Public Records
Map
Nearby Homes
- 403 W Beardsley Ave
- 402 W Eureka St
- 211 W Beardsley Ave
- 210 W Beardsley Ave
- 1003 N Randolph St
- 604 Alabama Ave
- 1303 Garden Ln
- 1010 N Neil St
- 1305 N Neil St
- 1107 N Hickory St
- 410 N State St Unit 15
- 410 N State St Unit 4
- 1305 N Walnut St
- 1311 N Walnut St
- 1212 N Walnut St
- 305 N Prairie St Unit 7
- 1308 N Champaign St
- 1310 1/2 N Champaign St
- 922 W Vine St
- 501 N Prospect Ave
- 1005 N Elm St
- 911 N Elm St
- 1007 1/2 N Elm St
- 416 W Eureka St
- 509 W Eureka St
- 501 1/2 W Beardsley Ave
- 503 W Beardsley Ave
- 505 W Beardsley Ave
- 501 W Beardsley Ave
- 414 W Eureka St
- 415 W Beardsley Ave
- 507 W Beardsley Ave
- 412 W Eureka St
- 413 W Beardsley Ave
- 509 W Beardsley Ave
- 511 W Beardsley Ave
- 411 W Beardsley Ave
- 410 W Eureka St
- 513 W Beardsley Ave
- 502 W Beardsley Ave