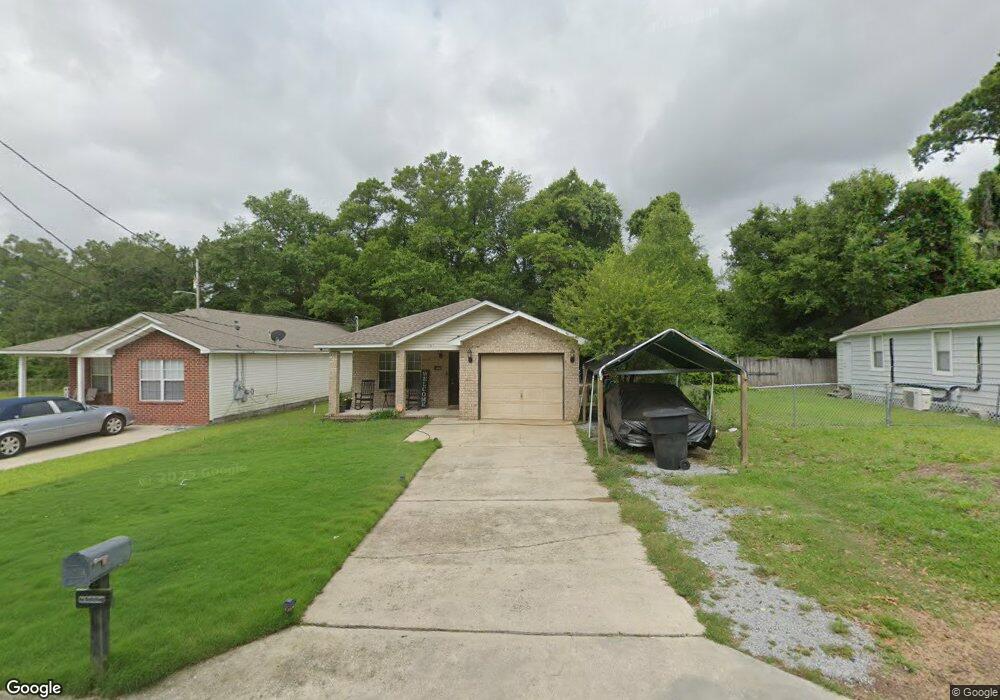
1003 N J St Pensacola, FL 32501
Estimated Value: $227,243 - $332,000
--
Bed
2
Baths
1,429
Sq Ft
$183/Sq Ft
Est. Value
About This Home
This home is located at 1003 N J St, Pensacola, FL 32501 and is currently estimated at $261,311, approximately $182 per square foot. 1003 N J St is a home located in Escambia County with nearby schools including C.A. Weis Elementary School, Warrington Middle School, and Pensacola High School.
Ownership History
Date
Name
Owned For
Owner Type
Purchase Details
Closed on
Apr 30, 2007
Sold by
C H Builders Llc
Bought by
Simmons Kelly N
Current Estimated Value
Home Financials for this Owner
Home Financials are based on the most recent Mortgage that was taken out on this home.
Original Mortgage
$80,000
Outstanding Balance
$48,475
Interest Rate
6.1%
Mortgage Type
Purchase Money Mortgage
Estimated Equity
$212,836
Purchase Details
Closed on
Oct 17, 2005
Sold by
Pate Patrick L and Pate Sonya
Bought by
C H Builders Llc
Home Financials for this Owner
Home Financials are based on the most recent Mortgage that was taken out on this home.
Original Mortgage
$13,600
Interest Rate
5.71%
Mortgage Type
Purchase Money Mortgage
Purchase Details
Closed on
May 1, 2000
Sold by
Washington Conrad J
Bought by
Pate Patrick L and Pate Sonya M
Purchase Details
Closed on
Apr 28, 2000
Sold by
Coeptis Dev Enterprises
Bought by
Washington Conrad J
Create a Home Valuation Report for This Property
The Home Valuation Report is an in-depth analysis detailing your home's value as well as a comparison with similar homes in the area
Home Values in the Area
Average Home Value in this Area
Purchase History
| Date | Buyer | Sale Price | Title Company |
|---|---|---|---|
| Simmons Kelly N | $130,000 | Attorney | |
| C H Builders Llc | $17,000 | First American Title Ins Co | |
| Pate Patrick L | $12,500 | -- | |
| Washington Conrad J | $4,000 | -- |
Source: Public Records
Mortgage History
| Date | Status | Borrower | Loan Amount |
|---|---|---|---|
| Open | Simmons Kelly N | $80,000 | |
| Previous Owner | C H Builders Llc | $13,600 |
Source: Public Records
Tax History Compared to Growth
Tax History
| Year | Tax Paid | Tax Assessment Tax Assessment Total Assessment is a certain percentage of the fair market value that is determined by local assessors to be the total taxable value of land and additions on the property. | Land | Improvement |
|---|---|---|---|---|
| 2024 | $878 | $92,359 | -- | -- |
| 2023 | $878 | $89,669 | $0 | $0 |
| 2022 | $842 | $87,058 | $0 | $0 |
| 2021 | $820 | $84,523 | $0 | $0 |
| 2020 | $795 | $83,357 | $0 | $0 |
| 2019 | $769 | $81,483 | $0 | $0 |
| 2018 | $758 | $79,964 | $0 | $0 |
| 2017 | $746 | $78,320 | $0 | $0 |
| 2016 | $730 | $76,710 | $0 | $0 |
| 2015 | $732 | $76,177 | $0 | $0 |
| 2014 | $728 | $75,573 | $0 | $0 |
Source: Public Records
Map
Nearby Homes