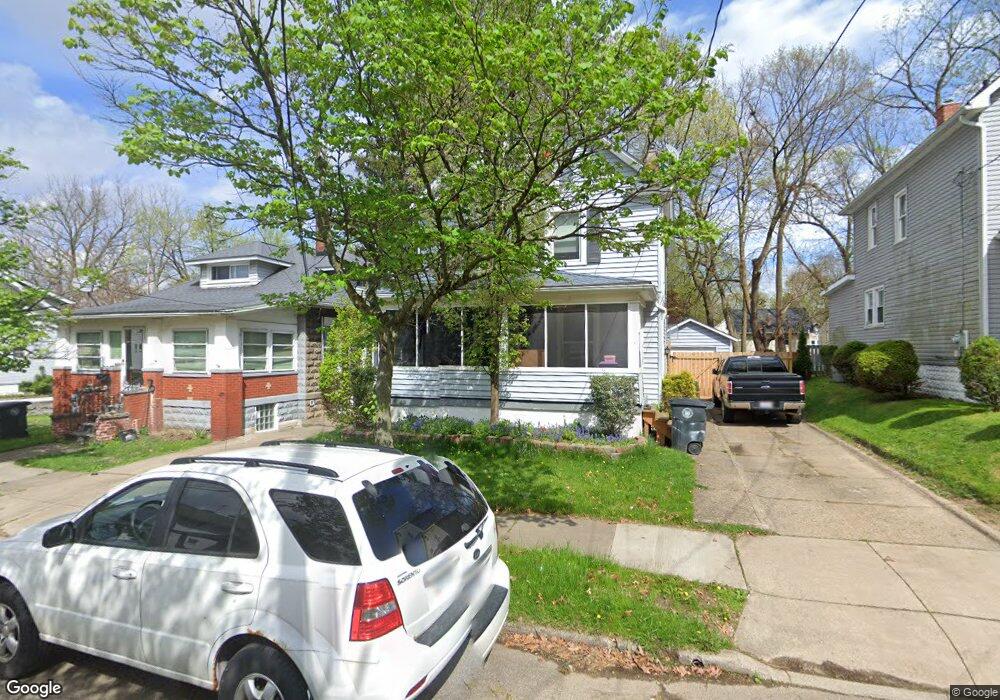
1003 Pitkin Ave Akron, OH 44310
North Hill NeighborhoodEstimated Value: $122,111 - $147,000
4
Beds
2
Baths
1,490
Sq Ft
$89/Sq Ft
Est. Value
About This Home
This home is located at 1003 Pitkin Ave, Akron, OH 44310 and is currently estimated at $132,528, approximately $88 per square foot. 1003 Pitkin Ave is a home located in Summit County with nearby schools including North High School, St. Vincent Elementary School, and St. Anthony of Padua Elementary School.
Ownership History
Date
Name
Owned For
Owner Type
Purchase Details
Closed on
Dec 23, 2008
Sold by
Sypherd Mark B and Sypherd Keli M
Bought by
Sypherd Mark B
Current Estimated Value
Home Financials for this Owner
Home Financials are based on the most recent Mortgage that was taken out on this home.
Original Mortgage
$40,000
Outstanding Balance
$26,507
Interest Rate
6.19%
Mortgage Type
New Conventional
Estimated Equity
$106,021
Purchase Details
Closed on
Dec 18, 2002
Sold by
Willey Keli M and Willey Keli M
Bought by
Sypherd Mark B and Sypherd Keli M
Home Financials for this Owner
Home Financials are based on the most recent Mortgage that was taken out on this home.
Original Mortgage
$40,000
Interest Rate
6.23%
Purchase Details
Closed on
Oct 28, 1998
Sold by
Fazzino Stephen P and Fazzino Mary F
Bought by
Willey Keli M
Home Financials for this Owner
Home Financials are based on the most recent Mortgage that was taken out on this home.
Original Mortgage
$64,600
Interest Rate
6.78%
Create a Home Valuation Report for This Property
The Home Valuation Report is an in-depth analysis detailing your home's value as well as a comparison with similar homes in the area
Home Values in the Area
Average Home Value in this Area
Purchase History
| Date | Buyer | Sale Price | Title Company |
|---|---|---|---|
| Sypherd Mark B | -- | Rels Title | |
| Sypherd Mark B | -- | Buckeye Reserve Title Agency | |
| Willey Keli M | $26,000 | Buckeye Reserve Title Agency |
Source: Public Records
Mortgage History
| Date | Status | Borrower | Loan Amount |
|---|---|---|---|
| Open | Sypherd Mark B | $40,000 | |
| Closed | Sypherd Mark B | $40,000 | |
| Closed | Willey Keli M | $64,600 |
Source: Public Records
Tax History
| Year | Tax Paid | Tax Assessment Tax Assessment Total Assessment is a certain percentage of the fair market value that is determined by local assessors to be the total taxable value of land and additions on the property. | Land | Improvement |
|---|---|---|---|---|
| 2024 | $1,929 | $36,233 | $5,702 | $30,531 |
| 2023 | $1,929 | $36,233 | $5,702 | $30,531 |
| 2022 | $1,726 | $25,362 | $3,959 | $21,403 |
| 2021 | $1,727 | $25,362 | $3,959 | $21,403 |
| 2020 | $1,701 | $25,360 | $3,960 | $21,400 |
| 2019 | $1,306 | $17,430 | $3,990 | $13,440 |
| 2018 | $1,288 | $17,430 | $3,990 | $13,440 |
| 2017 | $1,485 | $17,430 | $3,990 | $13,440 |
| 2016 | $1,486 | $19,920 | $4,560 | $15,360 |
| 2015 | $1,485 | $19,920 | $4,560 | $15,360 |
| 2014 | $1,473 | $19,920 | $4,560 | $15,360 |
| 2013 | $1,495 | $20,670 | $4,560 | $16,110 |
Source: Public Records
Map
Nearby Homes
- 1037 Pitkin Ave
- 1026 Woodward Ave
- 967 Oakland Ave Unit 969
- 1043 Oakland Ave
- 0 E Cuyahoga Falls Ave Unit 5188972
- 908 Dayton St
- 1062 Big Falls Ave
- 1091 Collinwood Ave
- 1121 Woodward Ave
- 1074 N Main St
- 1098 Big Falls Ave
- 230 Helen Ave
- 81 E Dalton St
- 868 N Main St
- 539 E Cuyahoga Falls Ave
- 1119 Mount Vernon Ave
- 1085 Chalker St
- 1206 Pitkin Ave
- 1191 Big Falls Ave
- 1101 Linden Ave
- 999 Pitkin Ave
- 1007 Pitkin Ave
- 997 Pitkin Ave
- 1002 Sawyer Ave
- 1006 Sawyer Ave
- 1015 Pitkin Ave
- 991 Pitkin Ave
- 998 Sawyer Ave
- 1010 Sawyer Ave
- 1002 Pitkin Ave
- 1000 Pitkin Ave
- 1006 Pitkin Ave
- 1019 Pitkin Ave
- 1014 Sawyer Ave
- 990 Sawyer Ave
- 983 Pitkin Ave
- 1010 Pitkin Ave
- 1018 Sawyer Ave
- 984 Sawyer Ave
- 1021 Pitkin Ave
Your Personal Tour Guide
Ask me questions while you tour the home.