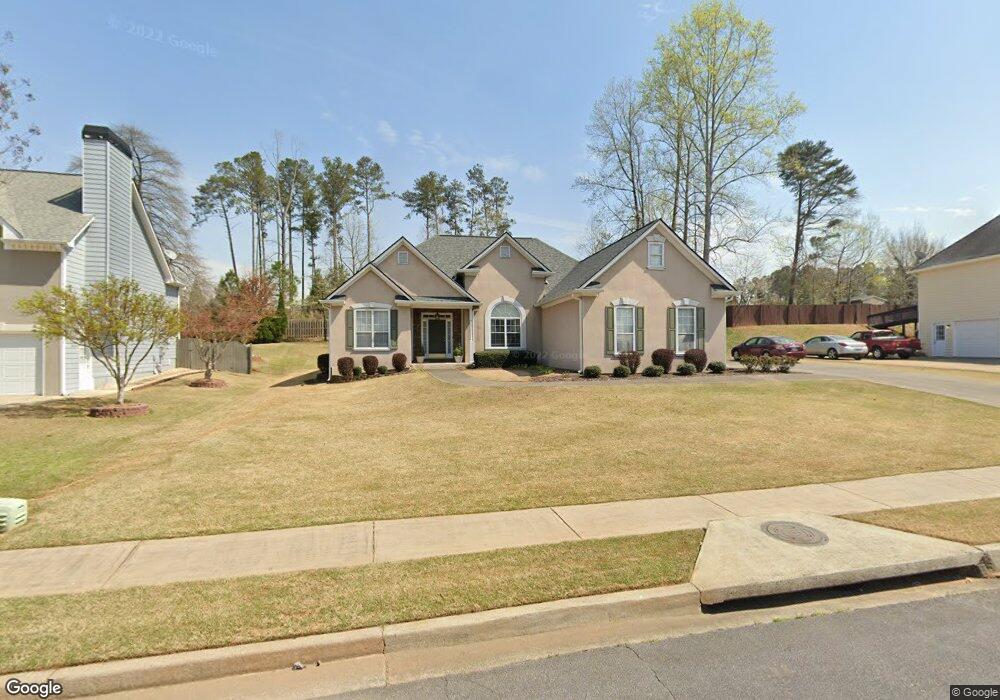
1003 Regency Dr Unit I Acworth, GA 30102
Oak Grove NeighborhoodEstimated Value: $376,535 - $406,000
3
Beds
2
Baths
1,805
Sq Ft
$217/Sq Ft
Est. Value
About This Home
This home is located at 1003 Regency Dr Unit I, Acworth, GA 30102 and is currently estimated at $391,268, approximately $216 per square foot. 1003 Regency Dr Unit I is a home located in Cherokee County with nearby schools including Boston Elementary School, E. T. Booth Middle School, and Etowah High School.
Ownership History
Date
Name
Owned For
Owner Type
Purchase Details
Closed on
May 11, 2001
Sold by
Ransom Jerry L
Bought by
Ransom Jerry L and Ransom Eleanor V
Current Estimated Value
Home Financials for this Owner
Home Financials are based on the most recent Mortgage that was taken out on this home.
Original Mortgage
$145,350
Interest Rate
7.23%
Mortgage Type
New Conventional
Purchase Details
Closed on
May 24, 1999
Sold by
Scott James H and Scott Shannon C
Bought by
Cole Patricia L
Home Financials for this Owner
Home Financials are based on the most recent Mortgage that was taken out on this home.
Original Mortgage
$110,320
Interest Rate
6.84%
Mortgage Type
New Conventional
Purchase Details
Closed on
Feb 19, 1997
Sold by
Summerfieldhomes Inc
Bought by
Scott James
Create a Home Valuation Report for This Property
The Home Valuation Report is an in-depth analysis detailing your home's value as well as a comparison with similar homes in the area
Home Values in the Area
Average Home Value in this Area
Purchase History
| Date | Buyer | Sale Price | Title Company |
|---|---|---|---|
| Ransom Jerry L | -- | -- | |
| Ransom Jerry L | $153,000 | -- | |
| Cole Patricia L | $137,900 | -- | |
| Scott James | $129,400 | -- |
Source: Public Records
Mortgage History
| Date | Status | Borrower | Loan Amount |
|---|---|---|---|
| Previous Owner | Ransom Jerry L | $145,350 | |
| Previous Owner | Cole Patricia L | $110,320 | |
| Closed | Scott James | $0 |
Source: Public Records
Tax History
| Year | Tax Paid | Tax Assessment Tax Assessment Total Assessment is a certain percentage of the fair market value that is determined by local assessors to be the total taxable value of land and additions on the property. | Land | Improvement |
|---|---|---|---|---|
| 2025 | $769 | $144,024 | $30,000 | $114,024 |
| 2024 | $749 | $144,968 | $30,000 | $114,968 |
| 2023 | $588 | $137,716 | $30,000 | $107,716 |
| 2022 | $690 | $115,440 | $30,000 | $85,440 |
| 2021 | $667 | $93,680 | $22,000 | $71,680 |
| 2020 | $631 | $83,440 | $16,000 | $67,440 |
| 2019 | $613 | $78,560 | $16,000 | $62,560 |
| 2018 | $602 | $72,840 | $16,000 | $56,840 |
| 2017 | $614 | $179,900 | $16,000 | $55,960 |
| 2016 | $610 | $165,100 | $14,400 | $51,640 |
| 2015 | $572 | $150,900 | $14,400 | $45,960 |
| 2014 | $512 | $135,200 | $11,600 | $42,480 |
Source: Public Records
Map
Nearby Homes
- 1463 Kellogg Creek Rd
- 702 Copper Trace Way
- 701 Copper Trace Way
- 700 Copper Trace Way
- 712 Copper Trace Way
- 135 Golden Hills Dr
- 210 Creek View Ln
- 200 Shoals Bridge Rd
- 1537 David Lee St
- 1179 Britley Park Ln Unit 2
- 1127 Britley Park Ln
- 1121 Britley Park Ln
- 315 Mirramont Ct
- 211 Chelsea Ct
- 1775 Cumberland Trace
- 104 Southfork Dr
- 208 Chelsea Ct
- 204 Chelsea Ct Unit 2
- 102 Peaceful View
- 1071 Braddock Cir Unit 3
- 503 Regency Dr
- 519 Regency Dr
- 525 Regency Dr
- 513 Regency Dr
- 507 Regency Dr
- 515 Regency Dr
- 1005 Regency Dr
- 1001 Regency Dr Unit 1
- 1007 Regency Dr
- 532 Regency Dr
- 526 Regency Dr
- 516 Regency Dr
- 504 Regency Dr
- 522 Regency Dr
- 502 Regency Dr
- 508 Regency Dr
- 100 Regency Chase Unit 1
- 1000 Regency Dr
- 1009 Regency Dr Unit 1
- 101 Regency Chase
Your Personal Tour Guide
Ask me questions while you tour the home.