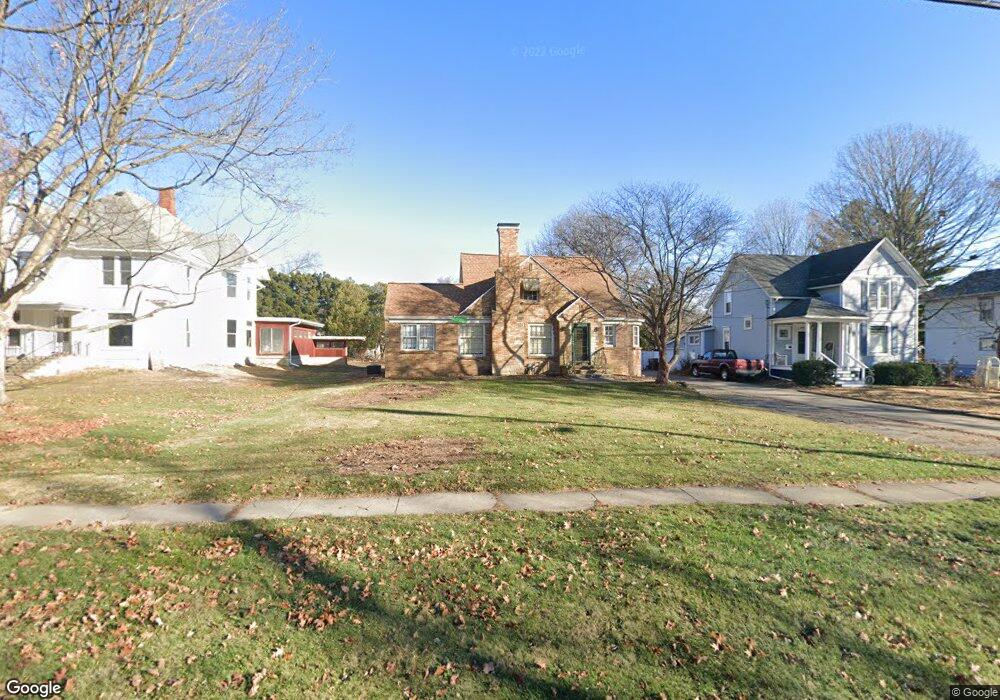
1003 S Euclid Ave Princeton, IL 61356
Estimated Value: $116,978 - $284,000
--
Bed
--
Bath
--
Sq Ft
0.28
Acres
About This Home
This home is located at 1003 S Euclid Ave, Princeton, IL 61356 and is currently estimated at $170,995. 1003 S Euclid Ave is a home located in Bureau County with nearby schools including Lincoln Elementary School, Jefferson Elementary School, and Logan Junior High School.
Ownership History
Date
Name
Owned For
Owner Type
Purchase Details
Closed on
Jan 30, 2025
Sold by
Mercer Sharon L and Erickson Dennis W
Bought by
Taylor Abby O
Current Estimated Value
Home Financials for this Owner
Home Financials are based on the most recent Mortgage that was taken out on this home.
Original Mortgage
$55,000
Outstanding Balance
$54,677
Interest Rate
6.97%
Mortgage Type
New Conventional
Estimated Equity
$116,318
Purchase Details
Closed on
Jul 11, 2022
Sold by
Euclid Avenue Land Trust
Bought by
Erickson Builders
Purchase Details
Closed on
Oct 11, 2021
Sold by
Tulli Edmund M and Kathleen N Tulli Separate Prop
Bought by
Russell Robert F and Euclid Ave Land Trust
Purchase Details
Closed on
Sep 22, 2021
Sold by
Suarez Brian and Suzrez Jay
Bought by
Russell Robert F and Euclid Avenue Land Trust
Purchase Details
Closed on
Aug 30, 2021
Sold by
Tulli Edmund M and Tulli Edmund M
Bought by
Russell Robert F and Euclid Ave Land Trust
Create a Home Valuation Report for This Property
The Home Valuation Report is an in-depth analysis detailing your home's value as well as a comparison with similar homes in the area
Home Values in the Area
Average Home Value in this Area
Purchase History
| Date | Buyer | Sale Price | Title Company |
|---|---|---|---|
| Taylor Abby O | $250,000 | None Listed On Document | |
| Erickson Builders | $100,000 | None Listed On Document | |
| Russell Robert F | -- | None Available | |
| Russell Robert F | -- | None Available | |
| Russell Robert F | -- | None Available | |
| Russell Robert F | -- | None Available | |
| Russell Robert F | -- | None Available |
Source: Public Records
Mortgage History
| Date | Status | Borrower | Loan Amount |
|---|---|---|---|
| Open | Taylor Abby O | $55,000 |
Source: Public Records
Tax History Compared to Growth
Tax History
| Year | Tax Paid | Tax Assessment Tax Assessment Total Assessment is a certain percentage of the fair market value that is determined by local assessors to be the total taxable value of land and additions on the property. | Land | Improvement |
|---|---|---|---|---|
| 2024 | $2,698 | $34,276 | $6,218 | $28,058 |
| 2023 | $2,698 | $31,568 | $5,727 | $25,841 |
| 2022 | $2,550 | $29,596 | $5,369 | $24,227 |
| 2021 | $2,494 | $28,016 | $5,082 | $22,934 |
| 2020 | $2,416 | $26,990 | $4,896 | $22,094 |
| 2019 | $5,459 | $60,031 | $4,837 | $55,194 |
| 2018 | $4,146 | $59,004 | $4,754 | $54,250 |
| 2017 | $4,203 | $59,217 | $4,771 | $54,446 |
| 2016 | $4,211 | $57,671 | $4,646 | $53,025 |
| 2015 | -- | $52,098 | $0 | $52,098 |
| 2014 | -- | $56,662 | $4,564 | $52,098 |
| 2013 | -- | $56,970 | $4,589 | $52,381 |
Source: Public Records
Map
Nearby Homes
- 1307 S Euclid Ave
- 1428 S Euclid Ave
- 1428 S Church St
- 525 E Marion St
- 625 S 5th Avenue Dr
- 443 E Peru St
- 305 S Chestnut St
- 221 W Peru St
- 20 S Church St
- 1840 S Main St
- 1310 Illinois 26
- 32 S Dallas St
- 411 W Peru St
- 778 W Boyd Ave
- 9 S Randolph St
- 210 N Church St
- 319 N Chestnut St
- 103 S Plum St
- 405 N Church St
- 21 N Gosse Blvd
- 1007 S Euclid Ave
- 927 S Euclid Ave
- 1015 S Euclid Ave
- 430 Griswold St
- 1004 S Euclid Ave
- 913 S Euclid Ave
- 930 S Euclid Ave
- 1014 S Euclid Ave
- 434 Griswold St
- 1025 S Euclid Ave
- 922 S Euclid Ave
- 427 Griswold St
- 433 E Thompson St
- 1020 S Euclid Ave
- 905 S Euclid Ave
- 438 Griswold St
- 912 S Euclid Ave
- 435 Griswold St
- 435 Griswold St
- 1028 S Euclid Ave