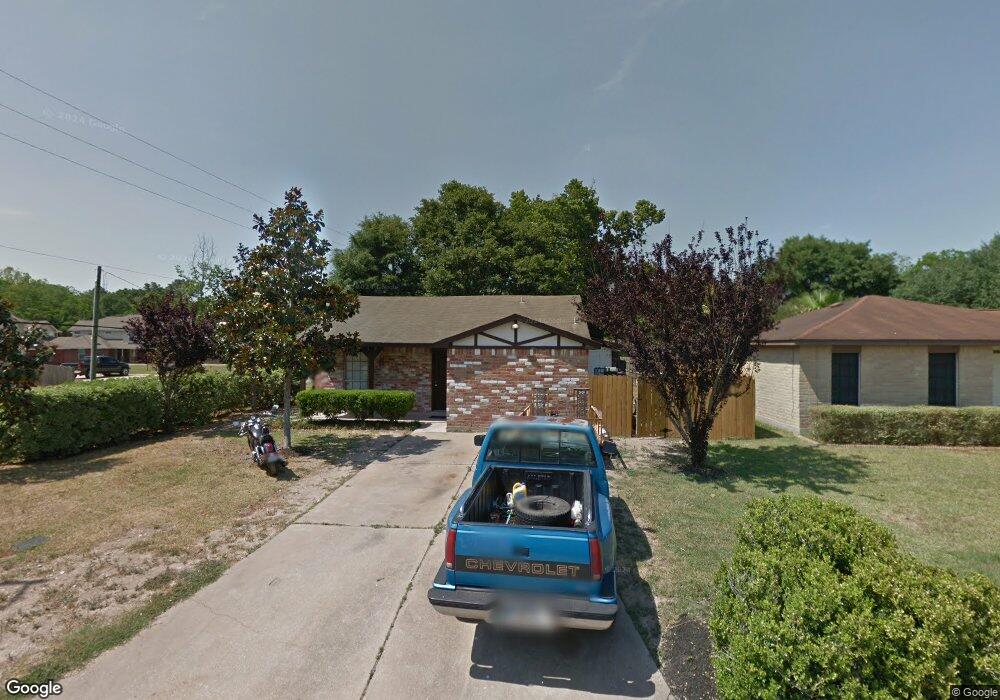
1003 Stoneleigh Ct Tomball, TX 77375
Estimated Value: $203,594 - $268,000
3
Beds
2
Baths
1,208
Sq Ft
$200/Sq Ft
Est. Value
About This Home
This home is located at 1003 Stoneleigh Ct, Tomball, TX 77375 and is currently estimated at $241,149, approximately $199 per square foot. 1003 Stoneleigh Ct is a home located in Harris County with nearby schools including Tomball Elementary School, Tomball Intermediate School, and Tomball Junior High School.
Ownership History
Date
Name
Owned For
Owner Type
Purchase Details
Closed on
Apr 19, 2024
Sold by
Hollingshead Harriet A
Bought by
Montgomery Melvin J and Montgomery Carla
Current Estimated Value
Home Financials for this Owner
Home Financials are based on the most recent Mortgage that was taken out on this home.
Original Mortgage
$125,000
Outstanding Balance
$117,524
Interest Rate
6.22%
Mortgage Type
Seller Take Back
Estimated Equity
$123,625
Purchase Details
Closed on
Mar 14, 2001
Sold by
Carter Michael D and Carter Debra E
Bought by
Hollingshead Ralph and Hollingshead Harriet A
Purchase Details
Closed on
Apr 3, 1996
Sold by
White Jerry A
Bought by
Carter Michael D and Carter Debra E
Home Financials for this Owner
Home Financials are based on the most recent Mortgage that was taken out on this home.
Original Mortgage
$37,350
Interest Rate
7.35%
Mortgage Type
Seller Take Back
Create a Home Valuation Report for This Property
The Home Valuation Report is an in-depth analysis detailing your home's value as well as a comparison with similar homes in the area
Home Values in the Area
Average Home Value in this Area
Purchase History
| Date | Buyer | Sale Price | Title Company |
|---|---|---|---|
| Montgomery Melvin J | -- | Stewart Title | |
| Hollingshead Ralph | -- | Stewart Title | |
| Carter Michael D | -- | Title Agency #50 |
Source: Public Records
Mortgage History
| Date | Status | Borrower | Loan Amount |
|---|---|---|---|
| Open | Montgomery Melvin J | $125,000 | |
| Previous Owner | Carter Michael D | $37,350 | |
| Closed | Hollingshead Ralph | $0 |
Source: Public Records
Tax History Compared to Growth
Tax History
| Year | Tax Paid | Tax Assessment Tax Assessment Total Assessment is a certain percentage of the fair market value that is determined by local assessors to be the total taxable value of land and additions on the property. | Land | Improvement |
|---|---|---|---|---|
| 2025 | $2,370 | $107,100 | $47,191 | $59,909 |
| 2024 | $2,370 | $107,100 | $47,191 | $59,909 |
| 2023 | $2,370 | $107,100 | $29,040 | $78,060 |
| 2022 | $2,414 | $107,100 | $29,040 | $78,060 |
| 2021 | $2,540 | $107,100 | $29,040 | $78,060 |
| 2020 | $3,270 | $133,337 | $29,040 | $104,297 |
| 2019 | $2,346 | $125,660 | $14,883 | $110,777 |
| 2018 | $2,348 | $93,000 | $14,883 | $78,117 |
| 2017 | $2,344 | $93,000 | $14,883 | $78,117 |
| 2016 | $2,503 | $99,343 | $14,883 | $84,460 |
| 2015 | $1,723 | $95,458 | $14,883 | $80,575 |
| 2014 | $1,723 | $67,700 | $14,883 | $52,817 |
Source: Public Records
Map
Nearby Homes
- 803 Junction Point Ln
- 1323 E Hufsmith Rd
- 24102 Flax Ct
- 1107 Grand Junction Dr
- 1123 Magnolia Branch Ln
- 1046 Bending Trail Dr
- 1114 Buffalo Run
- 1214 Hidden Oaks Dr
- 1231 Hidden Oaks Dr
- 23626 Golden Birch Bend
- 1306 Hidden Oaks Dr
- 532 Carrell St
- Portico D - with Bonus Suite Plan at Winfrey Estates
- Palazzo C - with Bonus Suite Plan at Winfrey Estates
- Palazzo A - Single-Level Plan at Winfrey Estates
- Promenade III A - Single-Level Plan at Winfrey Estates
- Portico E - Single-Level Plan at Winfrey Estates
- Portico A - Single-Level Plan at Winfrey Estates
- Palazzo B - Single-Level Plan at Winfrey Estates
- Promenade III B - Single-Level Plan at Winfrey Estates
- 1007 Stoneleigh Ct
- 1002 Misty Meadow Ct
- 1011 Stoneleigh Ct
- 1006 Misty Meadow Ct
- 1002 Stoneleigh Ct
- 1010 Misty Meadow Ct
- 1006 Stoneleigh Ct
- 1010 Stoneleigh Ct
- 1189 Lovett St
- 1014 Misty Meadow Ct
- 1233 Lovett St Unit 1205
- 1233 Lovett St Unit 1253
- 1233 Lovett St
- 1205 Lovett St
- 1259 Lovett St
- 1205 Lovett St Unit 1205
- 1203 Lovett St
- 1257 Lovett St
- 1257 Lovett St Unit 1257
- 1209 Lovett St Unit 1209