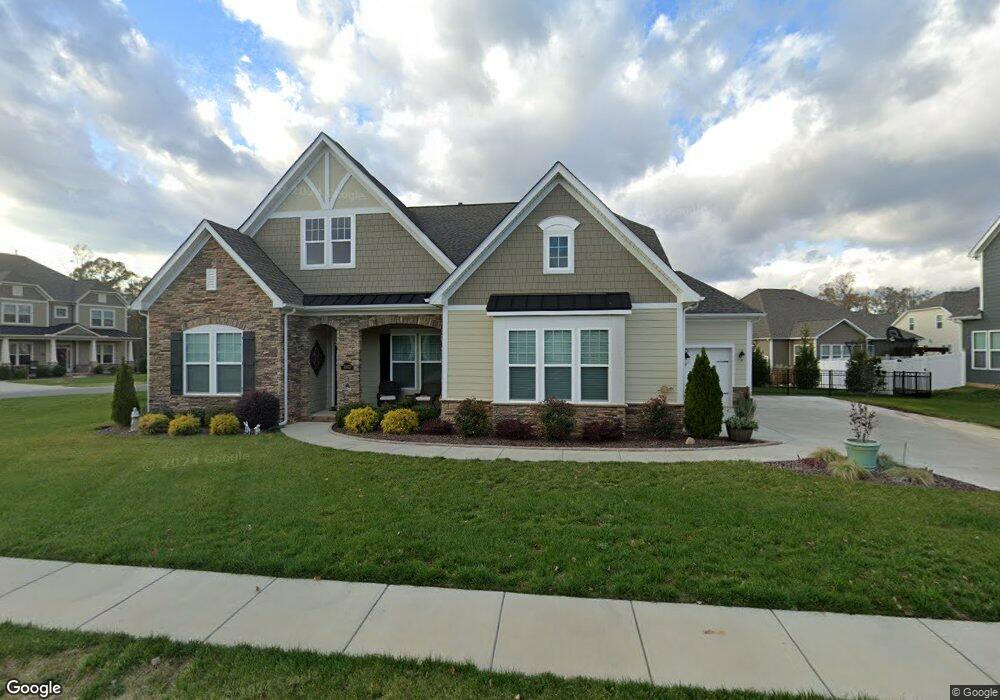
1003 Thessallian Ln Indian Trail, NC 28079
Estimated Value: $522,955 - $587,000
4
Beds
3
Baths
2,464
Sq Ft
$224/Sq Ft
Est. Value
About This Home
This home is located at 1003 Thessallian Ln, Indian Trail, NC 28079 and is currently estimated at $552,489, approximately $224 per square foot. 1003 Thessallian Ln is a home located in Union County with nearby schools including Poplin Elementary School, Porter Ridge Middle School, and Porter Ridge High School.
Ownership History
Date
Name
Owned For
Owner Type
Purchase Details
Closed on
Aug 4, 2016
Sold by
Potter Gary E and Potter Elaine
Bought by
Green Donna P
Current Estimated Value
Home Financials for this Owner
Home Financials are based on the most recent Mortgage that was taken out on this home.
Original Mortgage
$240,000
Outstanding Balance
$191,985
Interest Rate
3.56%
Mortgage Type
New Conventional
Estimated Equity
$360,504
Purchase Details
Closed on
Nov 9, 2015
Sold by
Bonterra Builders Llc
Bought by
Potter Gary E and Potter Elaine
Home Financials for this Owner
Home Financials are based on the most recent Mortgage that was taken out on this home.
Original Mortgage
$274,900
Interest Rate
3.89%
Mortgage Type
New Conventional
Purchase Details
Closed on
Jul 1, 2015
Sold by
Bonterra Builders Llc
Bought by
Bel Air Acquisition Sub Llc
Purchase Details
Closed on
Mar 16, 2015
Sold by
Wb Village Lp
Bought by
Bonterra Builders Llc
Create a Home Valuation Report for This Property
The Home Valuation Report is an in-depth analysis detailing your home's value as well as a comparison with similar homes in the area
Home Values in the Area
Average Home Value in this Area
Purchase History
| Date | Buyer | Sale Price | Title Company |
|---|---|---|---|
| Green Donna P | $343,500 | None Available | |
| Potter Gary E | $344,000 | Attorney | |
| Bel Air Acquisition Sub Llc | $2,957,000 | Attorney | |
| Bonterra Builders Llc | $215,000 | None Available |
Source: Public Records
Mortgage History
| Date | Status | Borrower | Loan Amount |
|---|---|---|---|
| Open | Green Donna P | $240,000 | |
| Previous Owner | Potter Gary E | $274,900 |
Source: Public Records
Tax History Compared to Growth
Tax History
| Year | Tax Paid | Tax Assessment Tax Assessment Total Assessment is a certain percentage of the fair market value that is determined by local assessors to be the total taxable value of land and additions on the property. | Land | Improvement |
|---|---|---|---|---|
| 2024 | $2,887 | $342,500 | $65,000 | $277,500 |
| 2023 | $2,862 | $342,500 | $65,000 | $277,500 |
| 2022 | $2,862 | $342,500 | $65,000 | $277,500 |
| 2021 | $2,862 | $342,500 | $65,000 | $277,500 |
| 2020 | $2,060 | $264,200 | $53,000 | $211,200 |
| 2019 | $2,612 | $264,200 | $53,000 | $211,200 |
| 2018 | $2,060 | $264,200 | $53,000 | $211,200 |
| 2017 | $2,914 | $280,500 | $53,000 | $227,500 |
| 2016 | $2,820 | $276,900 | $53,000 | $223,900 |
| 2015 | $439 | $276,900 | $53,000 | $223,900 |
Source: Public Records
Map
Nearby Homes
- 1018 Back Stretch Blvd
- 2015 Trigger Dr
- 1036 Preakness Blvd
- 211 Aldendale Dr
- 1011 Phar Lap Dr
- 1515 Saratoga Blvd
- 280 Portrait Way
- 2324 Bonterra Blvd
- 267 Portrait Way
- 1305 Belmont Stakes Ave
- 1002 Phar Lap Dr
- 4003 Ladys Secret Dr
- 1021 Hercules Dr
- 4106 Twenty Grand Dr
- 1522 Ainslie Place Rd Unit 42 / Marshall
- 405 Northgate Blvd
- 1018 Equipoise Dr
- 0 Saratoga Blvd
- #24 Moser Cir
- 523 Sunharvest Ln
- 1007 Thessallian Ln
- 1808 Painted Horse Dr
- 1808 Painted Horse Dr Unit 730
- 1006 Thessallian Ln
- 1002 Thessallian Ln
- 1011 Thessallian Ln
- 1805 Painted Horse Dr
- 1010 Thessallian Ln
- 1801 Painted Horse Dr
- 1801 Painted Horse Dr Unit 709
- 1713 Painted Horse Dr
- 1812 Painted Horse Dr
- 1014 Thessallian Ln
- 1015 Thessallian Ln
- 1809 Painted Horse Dr
- 1816 Painted Horse Dr
- 1007 Slew O Gold Ln
- 1018 Thessallian Ln
- 1003 Slew O Gold Ln
- 1011 Slew O Gold Ln