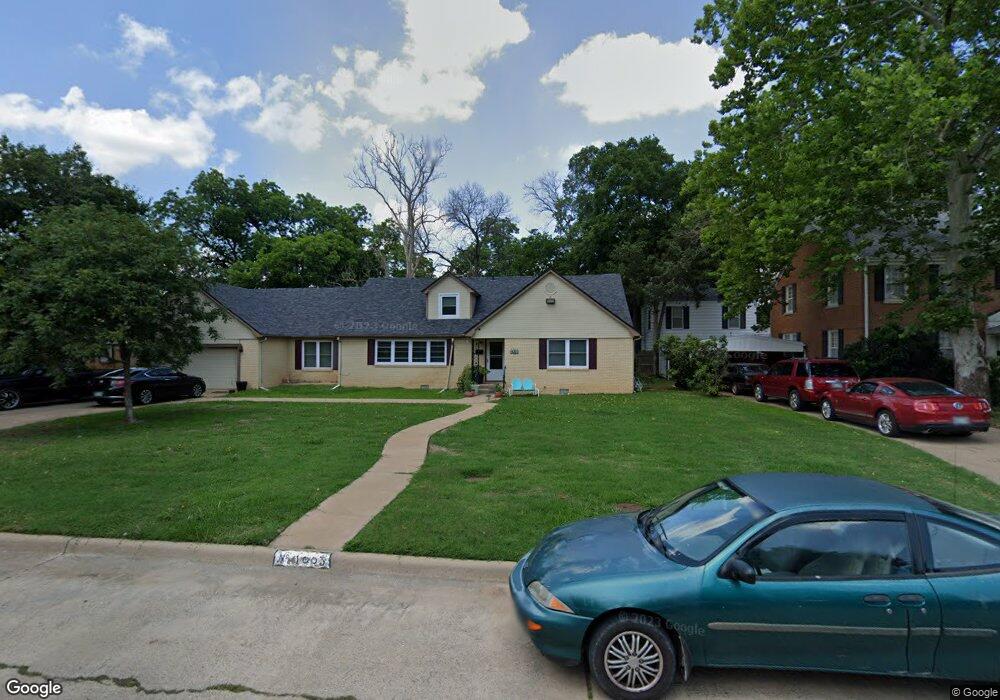
1003 W Spruce Ave Duncan, OK 73533
Estimated Value: $226,000 - $280,920
4
Beds
3
Baths
2,997
Sq Ft
$89/Sq Ft
Est. Value
About This Home
This home is located at 1003 W Spruce Ave, Duncan, OK 73533 and is currently estimated at $265,480, approximately $88 per square foot. 1003 W Spruce Ave is a home located in Stephens County with nearby schools including Emerson Elementary School, Duncan Middle School, and Duncan High School.
Ownership History
Date
Name
Owned For
Owner Type
Purchase Details
Closed on
Apr 15, 2015
Sold by
Flanigan Cindy Kristine and Reynolds Cindy Kristine
Bought by
Brown Michale and Brown Kasey
Current Estimated Value
Home Financials for this Owner
Home Financials are based on the most recent Mortgage that was taken out on this home.
Original Mortgage
$182,631
Outstanding Balance
$142,508
Interest Rate
4.12%
Mortgage Type
FHA
Estimated Equity
$122,972
Purchase Details
Closed on
Jun 29, 2012
Sold by
Reynolds Mark Carlton
Bought by
Reynolds Cindy Kristine
Purchase Details
Closed on
Sep 22, 2008
Sold by
Goodson Jerry D and Goodson Daphne Jane
Bought by
Reynolds Mark C and Reynolds Cindy K
Home Financials for this Owner
Home Financials are based on the most recent Mortgage that was taken out on this home.
Original Mortgage
$145,000
Interest Rate
6.57%
Mortgage Type
New Conventional
Create a Home Valuation Report for This Property
The Home Valuation Report is an in-depth analysis detailing your home's value as well as a comparison with similar homes in the area
Home Values in the Area
Average Home Value in this Area
Purchase History
| Date | Buyer | Sale Price | Title Company |
|---|---|---|---|
| Brown Michale | $186,000 | None Available | |
| Reynolds Cindy Kristine | -- | None Available | |
| Reynolds Mark C | $155,000 | None Available |
Source: Public Records
Mortgage History
| Date | Status | Borrower | Loan Amount |
|---|---|---|---|
| Open | Brown Michale | $182,631 | |
| Previous Owner | Reynolds Mark C | $145,000 |
Source: Public Records
Tax History Compared to Growth
Tax History
| Year | Tax Paid | Tax Assessment Tax Assessment Total Assessment is a certain percentage of the fair market value that is determined by local assessors to be the total taxable value of land and additions on the property. | Land | Improvement |
|---|---|---|---|---|
| 2025 | $1,820 | $20,305 | $737 | $19,568 |
| 2024 | $1,820 | $21,365 | $737 | $20,628 |
| 2023 | $1,820 | $21,526 | $737 | $20,789 |
| 2022 | $1,832 | $21,686 | $737 | $20,949 |
| 2021 | $1,748 | $20,526 | $737 | $19,789 |
| 2020 | $1,858 | $21,521 | $737 | $20,784 |
| 2019 | $1,773 | $20,496 | $737 | $19,759 |
| 2018 | $1,771 | $19,884 | $737 | $19,147 |
| 2017 | $1,758 | $20,457 | $737 | $19,720 |
| 2016 | $1,750 | $20,584 | $737 | $19,847 |
| 2015 | $1,165 | $14,560 | $524 | $14,036 |
| 2014 | $1,165 | $14,136 | $495 | $13,641 |
Source: Public Records
Map
Nearby Homes
- 1001 1001 W Hackberry
- 1112 W Spruce St
- 810 810 N 12th St
- 1112 1112 N 12th
- 1105 1105 N Grand Ave
- 1114 N 13th St
- 1213 W Pine Ave
- 1202 N Grand Blvd
- 705 705 W Hackberry Ave
- 1444 1444 N 8th St
- 815 N 14th St
- 812 N 15th St
- 1116 1116 W Chestnut
- 1312 Pkwy
- 1105 W Beech Ave
- 805 805 N 5th
- 1112 N 5th St
- 1412 N 12th St
- 1107 W Elk Ave
- 1402 1402 W Elk Ave
- 1009 W Spruce Ave
- 1001 W Spruce Ave
- 1011 W Spruce Ave
- 1006 1006 W Hackberry
- 1004 W Hackberry Ave
- 1006 W Hackberry Ave
- 1013 W Spruce Ave
- 1008 W Hackberry Ave
- 1013 W Spruce St
- 915 N 10th St
- 1010 W Hackberry Ave
- 1015 W Spruce Ave
- 1014 W Hackberry Ave
- 915 W Spruce Ave
- 1002 W Spruce Ave
- 1008 W Spruce Ave
- 1006 W Spruce Ave
- 1016 W Hackberry Ave
- 1010 W Spruce Ave
- 908 N 10th St