1003 Walnut St Duncombe, IA 50532
Estimated Value: $101,000 - $135,000
3
Beds
1
Bath
960
Sq Ft
$128/Sq Ft
Est. Value
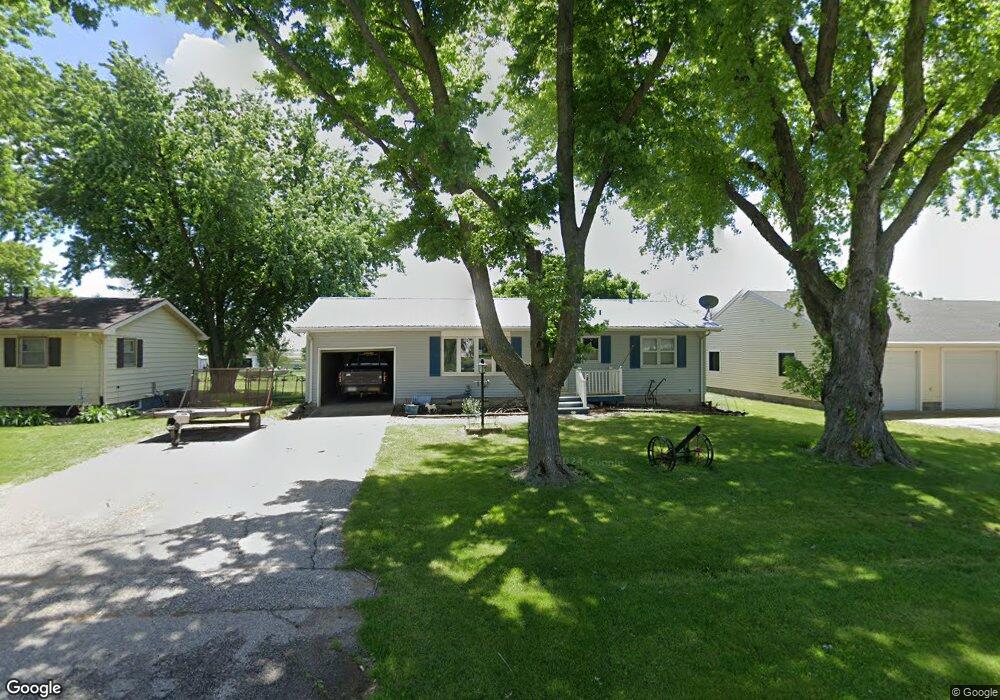
About This Home
This home is located at 1003 Walnut St, Duncombe, IA 50532 and is currently estimated at $122,846, approximately $127 per square foot. 1003 Walnut St is a home located in Webster County with nearby schools including Pleasant View Elementary School, Northeast Hamilton Elementary School, and Sunset Heights Elementary School.
Ownership History
Date
Name
Owned For
Owner Type
Purchase Details
Closed on
Jul 26, 2018
Sold by
Smith Troy
Bought by
Taylor Steven E
Current Estimated Value
Purchase Details
Closed on
Nov 26, 2007
Sold by
Taylor Steven E
Bought by
Taylor Steven E
Home Financials for this Owner
Home Financials are based on the most recent Mortgage that was taken out on this home.
Original Mortgage
$74,100
Interest Rate
6.33%
Mortgage Type
New Conventional
Create a Home Valuation Report for This Property
The Home Valuation Report is an in-depth analysis detailing your home's value as well as a comparison with similar homes in the area
Purchase History
We collect this data history from publicly available records. To have your information removed, we recommend requesting removal directly through your county’s website.
| Date | Buyer | Sale Price | Title Company |
|---|---|---|---|
| Taylor Steven E | $30,000 | -- | |
| Taylor Steven E | -- | None Available |
Source: Public Records
Mortgage History
We collect this data history from publicly available records. To have your information removed, we recommend requesting removal directly through your county’s website.
| Date | Status | Borrower | Loan Amount |
|---|---|---|---|
| Previous Owner | Taylor Steven E | $74,100 |
Source: Public Records
Tax History
| Year | Tax Paid | Tax Assessment Tax Assessment Total Assessment is a certain percentage of the fair market value that is determined by local assessors to be the total taxable value of land and additions on the property. | Land | Improvement |
|---|---|---|---|---|
| 2025 | $1,149 | $92,730 | $5,940 | $86,790 |
| 2024 | $1,144 | $87,530 | $5,940 | $81,590 |
| 2023 | $1,202 | $87,530 | $5,940 | $81,590 |
| 2022 | $1,170 | $77,300 | $5,940 | $71,360 |
| 2021 | $1,188 | $77,300 | $5,940 | $71,360 |
| 2020 | $1,188 | $75,610 | $5,940 | $69,670 |
| 2019 | $1,180 | $83,260 | $10,890 | $72,370 |
| 2018 | $1,251 | $75,690 | $9,900 | $65,790 |
| 2017 | $1,246 | $69,070 | $0 | $0 |
| 2016 | $1,152 | $69,070 | $0 | $0 |
| 2015 | $1,152 | $69,070 | $0 | $0 |
| 2014 | $1,154 | $69,070 | $0 | $0 |
Source: Public Records
Map
Nearby Homes
- 415 Wagner St
- 0 Folger and Prince Unit 29723
- 602 Folger St
- 0 Folger St
- 0 260th St
- 00 260th St
- 2107 Erickson Ave
- 2414 Poplar Ave
- 2215 Fenton Ave
- 00 250th St
- 2703 Racine Ave
- 1281 170th St
- 0 Fisher Ave
- 00 Fisher Ave
- 2327 Quail Ave
- 00 Quail Ave
- 1544 Division St
- 1611 Grand St
- TBD- Lot 5 S 42nd St
- 2434 Elm Dr
Your Personal Tour Guide
Ask me questions while you tour the home.