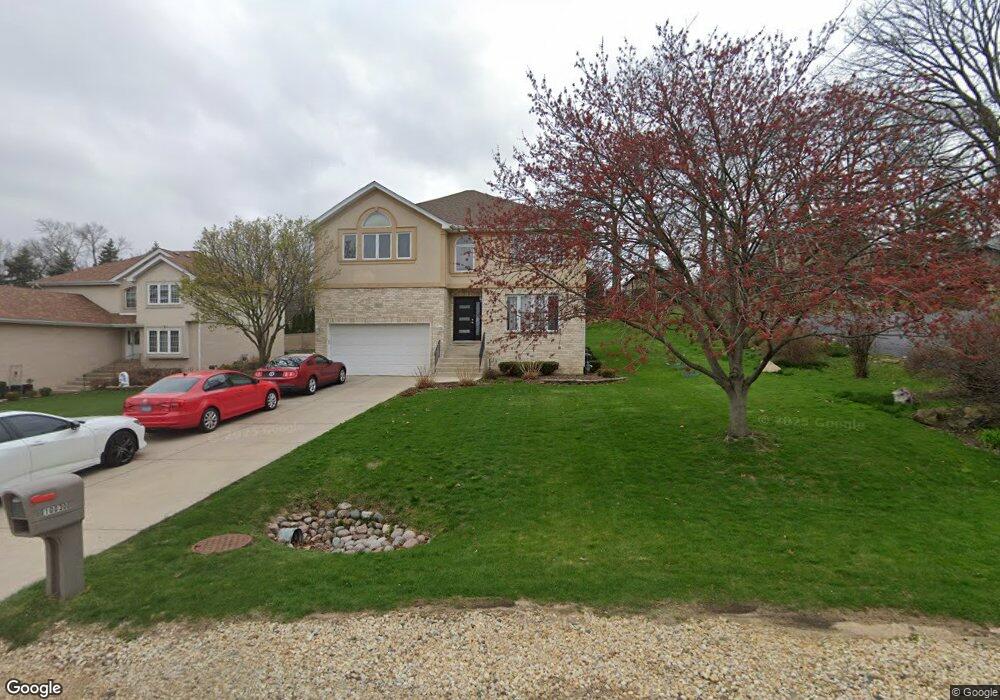
10030 S 83rd Ct Palos Hills, IL 60465
Estimated Value: $496,000 - $540,000
4
Beds
3
Baths
2,735
Sq Ft
$193/Sq Ft
Est. Value
About This Home
This home is located at 10030 S 83rd Ct, Palos Hills, IL 60465 and is currently estimated at $527,171, approximately $192 per square foot. 10030 S 83rd Ct is a home located in Cook County with nearby schools including Sorrick Elementary School, Oak Ridge Elementary School, and H H Conrady Jr High School.
Ownership History
Date
Name
Owned For
Owner Type
Purchase Details
Closed on
Nov 18, 1999
Sold by
Nelson Christopher
Bought by
Biernack Jack H and Biernack Marzena
Current Estimated Value
Home Financials for this Owner
Home Financials are based on the most recent Mortgage that was taken out on this home.
Original Mortgage
$263,000
Interest Rate
8.26%
Mortgage Type
Stand Alone First
Purchase Details
Closed on
May 10, 1999
Sold by
Gomez Margaret S
Bought by
Nelson Christopher and Nelson Construction
Home Financials for this Owner
Home Financials are based on the most recent Mortgage that was taken out on this home.
Original Mortgage
$115,000
Interest Rate
6.92%
Purchase Details
Closed on
Jun 23, 1992
Sold by
Cosmopolitan National Bank Of Chicago
Bought by
Moreno Anita
Create a Home Valuation Report for This Property
The Home Valuation Report is an in-depth analysis detailing your home's value as well as a comparison with similar homes in the area
Home Values in the Area
Average Home Value in this Area
Purchase History
| Date | Buyer | Sale Price | Title Company |
|---|---|---|---|
| Biernack Jack H | $253,000 | Chicago Title Insurance Co | |
| Nelson Christopher | $145,000 | -- | |
| Moreno Anita | -- | -- |
Source: Public Records
Mortgage History
| Date | Status | Borrower | Loan Amount |
|---|---|---|---|
| Previous Owner | Biernack Jack H | $263,000 | |
| Previous Owner | Nelson Christopher | $115,000 |
Source: Public Records
Tax History
| Year | Tax Paid | Tax Assessment Tax Assessment Total Assessment is a certain percentage of the fair market value that is determined by local assessors to be the total taxable value of land and additions on the property. | Land | Improvement |
|---|---|---|---|---|
| 2025 | $11,333 | $38,545 | $7,748 | $30,797 |
| 2024 | $11,333 | $38,545 | $7,748 | $30,797 |
| 2023 | $9,460 | $42,537 | $7,748 | $34,789 |
| 2022 | $9,460 | $29,345 | $6,748 | $22,597 |
| 2021 | $9,198 | $29,344 | $6,747 | $22,597 |
| 2020 | $9,084 | $29,344 | $6,747 | $22,597 |
| 2019 | $8,704 | $28,675 | $6,248 | $22,427 |
| 2018 | $8,866 | $30,152 | $6,248 | $23,904 |
| 2017 | $9,578 | $33,297 | $6,248 | $27,049 |
| 2016 | $8,992 | $28,527 | $5,498 | $23,029 |
| 2015 | $8,823 | $28,527 | $5,498 | $23,029 |
| 2014 | $8,683 | $28,527 | $5,498 | $23,029 |
| 2013 | $6,522 | $23,440 | $5,498 | $17,942 |
Source: Public Records
Map
Nearby Homes
- 10041 S Walnut Terrace Unit 31307
- 10148 S 84th Terrace Unit 315
- 9954 S 84th Terrace Unit 109
- 10221 S Eleanor Ave
- 10205 S 86th Terrace Unit 3310
- 10020 S 80th Ct
- 10226 S 81st Ave
- 10363 S 84th Ave
- 10138 S 87th Ave
- 10408 S Alta Dr
- 10433 S 83rd Ave
- 10441 S 83rd Ave
- 10218 S 87th Ct
- 7930 W 99th St
- 9716 S Kingsbury Ct
- 7932 W 98th Place
- 8821 W 100th St
- 10530 S 82nd Ct
- 10459 S 81st Ave
- 8732 W Surrey Park
- 10040 S 83rd Ct
- 10037 S 84th Ave
- 10046 S 83rd Ct
- 8360 W 100th Place
- 10028 S Wood Ln
- 10035 S 83rd Ct
- 10031 S 84th Ave
- 10039 S 83rd Ct
- 10055 S 84th Ave
- 10056 S 83rd Ct
- 10041 S 83rd Ct
- 10012 S Wood Ln
- 10023 S 84th Ave
- 10029 S Wood Ln
- 10043 S 83rd Ct
- 10100 S 83rd Ct
- 10030 S 83rd Ave
- 10101 S 84th Ave
- 8311 W 100th Place
- 10000 S Wood Ln
Your Personal Tour Guide
Ask me questions while you tour the home.