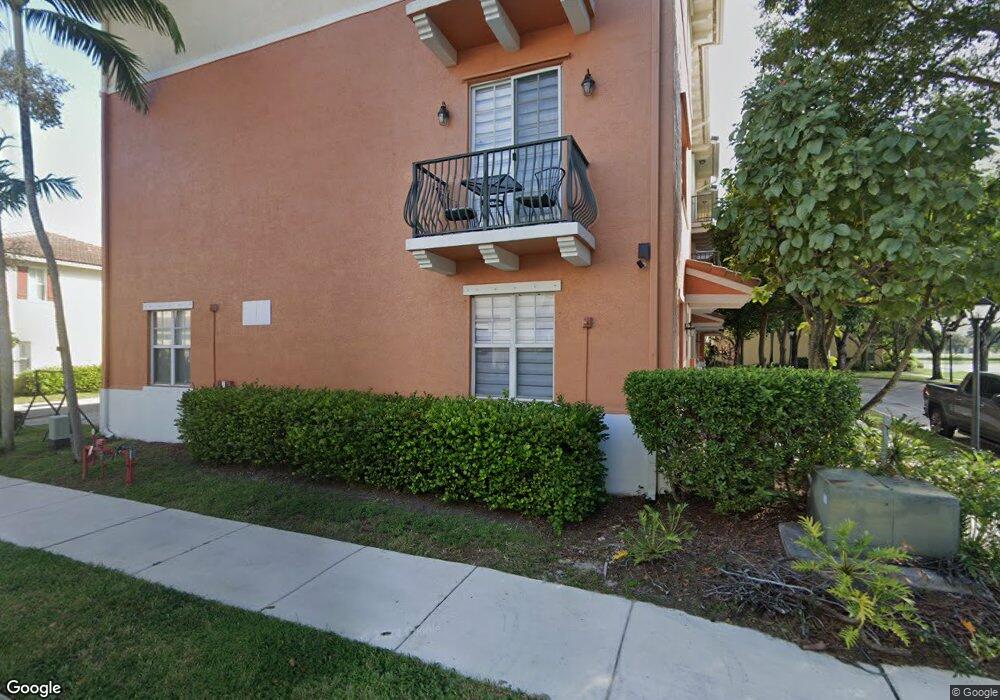
10031 SW 22nd St Unit 10031 Miramar, FL 33025
Lakeside South NeighborhoodEstimated Value: $450,000 - $507,739
3
Beds
4
Baths
2,020
Sq Ft
$239/Sq Ft
Est. Value
About This Home
This home is located at 10031 SW 22nd St Unit 10031, Miramar, FL 33025 and is currently estimated at $482,685, approximately $238 per square foot. 10031 SW 22nd St Unit 10031 is a home located in Broward County with nearby schools including Sea Castle Elementary School, New Renaissance Middle School, and Miramar High School.
Ownership History
Date
Name
Owned For
Owner Type
Purchase Details
Closed on
May 17, 2010
Sold by
Aurora Loan Services Llc
Bought by
Martinez Javier Torres
Current Estimated Value
Home Financials for this Owner
Home Financials are based on the most recent Mortgage that was taken out on this home.
Original Mortgage
$184,515
Outstanding Balance
$126,366
Interest Rate
5.5%
Mortgage Type
FHA
Estimated Equity
$356,319
Purchase Details
Closed on
Jun 29, 2009
Sold by
Niazov Shlomo
Bought by
Aurora Loan Services Llc
Purchase Details
Closed on
Aug 14, 2007
Sold by
New Urban Mirabella Llc
Bought by
Niazov Shlomo
Home Financials for this Owner
Home Financials are based on the most recent Mortgage that was taken out on this home.
Original Mortgage
$307,445
Interest Rate
8.47%
Mortgage Type
Purchase Money Mortgage
Create a Home Valuation Report for This Property
The Home Valuation Report is an in-depth analysis detailing your home's value as well as a comparison with similar homes in the area
Home Values in the Area
Average Home Value in this Area
Purchase History
| Date | Buyer | Sale Price | Title Company |
|---|---|---|---|
| Martinez Javier Torres | $187,000 | Attorney | |
| Aurora Loan Services Llc | -- | Attorney | |
| Niazov Shlomo | $341,700 | Multiple |
Source: Public Records
Mortgage History
| Date | Status | Borrower | Loan Amount |
|---|---|---|---|
| Open | Martinez Javier Torres | $184,515 | |
| Previous Owner | Niazov Shlomo | $307,445 |
Source: Public Records
Tax History Compared to Growth
Tax History
| Year | Tax Paid | Tax Assessment Tax Assessment Total Assessment is a certain percentage of the fair market value that is determined by local assessors to be the total taxable value of land and additions on the property. | Land | Improvement |
|---|---|---|---|---|
| 2025 | $6,586 | $348,210 | -- | -- |
| 2024 | $6,428 | $338,400 | -- | -- |
| 2023 | $6,428 | $328,550 | $0 | $0 |
| 2022 | $6,016 | $318,990 | $0 | $0 |
| 2021 | $5,922 | $309,700 | $35,400 | $274,300 |
| 2020 | $3,292 | $178,440 | $0 | $0 |
| 2019 | $3,248 | $174,430 | $0 | $0 |
| 2018 | $3,118 | $171,180 | $0 | $0 |
| 2017 | $3,003 | $167,660 | $0 | $0 |
| 2016 | $2,985 | $164,220 | $0 | $0 |
| 2015 | $2,979 | $163,080 | $0 | $0 |
| 2014 | $2,932 | $161,790 | $0 | $0 |
| 2013 | -- | $159,400 | $35,380 | $124,020 |
Source: Public Records
Map
Nearby Homes
- 2452 SW 99th Way
- 1821 SW 98th Terrace
- 1912 SW 97th Terrace
- 10161 SW 21st St
- 1851 SW 101st Way
- 9701 Millpond Rd
- 1710 SW 98th Terrace
- 10219 SW 18th Ct
- 2771 River Run Cir W
- 9941 SW 16th St
- 1845 SW 102nd Way
- 10320 SW 18th St
- 10311 SW 18th St
- 1500 SW 98th Ave
- 9701 SW 16th St
- 10400 SW 24th Ct
- 10471 SW 24th Ct
- 9511 Hudson St
- 9601 Encino St
- 1430 SW 102nd Ave
- 10031 SW 22nd St
- 10025 SW 22nd St Unit na
- 10025 SW 22nd St
- 10019 SW 22nd St
- 10013 SW 22nd St Unit 10013
- 10013 SW 22nd St
- 10040 SW 21st St
- 10007 SW 22nd St Unit 10007
- 10007 SW 22nd St Unit 59
- 2162 SW 100th Terrace
- 2152 SW 100th Terrace
- 2172 SW 100th Terrace
- 2182 SW 100th Terrace Unit 42
- 2182 SW 100th Terrace Unit 42-3rd F
- 2182 SW 100th Terrace Unit 42-2nd Floor
- 10030 SW 21st St Unit 53
- 10001 SW 22nd St
- 2142 SW 100th Terrace
- 2132 SW 100th Terrace Unit 47