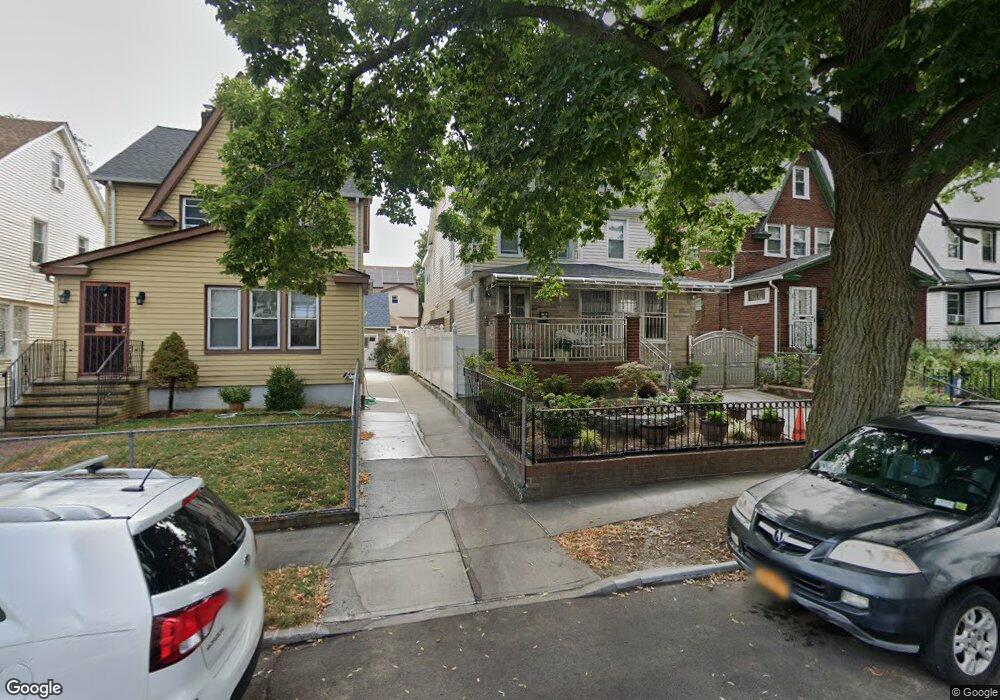
10033 204th St Hollis, NY 11423
Hollis NeighborhoodEstimated Value: $771,000 - $833,000
--
Bed
--
Bath
1,821
Sq Ft
$441/Sq Ft
Est. Value
About This Home
This home is located at 10033 204th St, Hollis, NY 11423 and is currently estimated at $803,151, approximately $441 per square foot. 10033 204th St is a home located in Queens County with nearby schools including P.S. 134 Langston Hughes School, I.S. 192 The Linden, and Incarnation Catholic Academy.
Ownership History
Date
Name
Owned For
Owner Type
Purchase Details
Closed on
Apr 29, 2019
Sold by
Kieran Construction Llc
Bought by
Rahman Rafiqul and Rahman Sonia
Current Estimated Value
Home Financials for this Owner
Home Financials are based on the most recent Mortgage that was taken out on this home.
Original Mortgage
$520,000
Outstanding Balance
$455,296
Interest Rate
4.2%
Mortgage Type
New Conventional
Estimated Equity
$347,855
Purchase Details
Closed on
Sep 25, 2018
Sold by
Ebanks Winston
Bought by
Kieran Construction Llc
Purchase Details
Closed on
Mar 14, 2006
Sold by
Ebanks Winston and Ebanks Doreen
Bought by
Ebanks Winston
Home Financials for this Owner
Home Financials are based on the most recent Mortgage that was taken out on this home.
Original Mortgage
$335,000
Interest Rate
6.26%
Mortgage Type
Purchase Money Mortgage
Create a Home Valuation Report for This Property
The Home Valuation Report is an in-depth analysis detailing your home's value as well as a comparison with similar homes in the area
Home Values in the Area
Average Home Value in this Area
Purchase History
| Date | Buyer | Sale Price | Title Company |
|---|---|---|---|
| Rahman Rafiqul | $650,000 | -- | |
| Rahman Rafiqul | $650,000 | -- | |
| Kieran Construction Llc | $223,482 | -- | |
| Kieran Construction Llc | $223,482 | -- | |
| Ebanks Winston | -- | -- | |
| Ebanks Winston | -- | -- |
Source: Public Records
Mortgage History
| Date | Status | Borrower | Loan Amount |
|---|---|---|---|
| Open | Rahman Rafiqul | $520,000 | |
| Closed | Rahman Rafiqul | $520,000 | |
| Previous Owner | Ebanks Winston | $335,000 |
Source: Public Records
Tax History Compared to Growth
Tax History
| Year | Tax Paid | Tax Assessment Tax Assessment Total Assessment is a certain percentage of the fair market value that is determined by local assessors to be the total taxable value of land and additions on the property. | Land | Improvement |
|---|---|---|---|---|
| 2025 | $5,839 | $30,672 | $7,888 | $22,784 |
| 2024 | $5,839 | $29,071 | $7,750 | $21,321 |
| 2023 | $5,509 | $27,427 | $7,675 | $19,752 |
| 2022 | $5,166 | $38,700 | $11,820 | $26,880 |
| 2021 | $5,446 | $32,100 | $11,820 | $20,280 |
| 2020 | $5,410 | $35,280 | $11,820 | $23,460 |
| 2019 | $5,068 | $30,540 | $11,820 | $18,720 |
| 2018 | $4,659 | $22,856 | $9,439 | $13,417 |
| 2017 | $4,396 | $21,565 | $10,362 | $11,203 |
| 2016 | $4,311 | $21,565 | $10,362 | $11,203 |
| 2015 | $2,234 | $21,300 | $13,140 | $8,160 |
| 2014 | $2,234 | $20,189 | $12,455 | $7,734 |
Source: Public Records
Map
Nearby Homes
- 100-35 204th St
- 10035 204th St
- 204-20 104th Ave
- 10411 205th St
- 100-15 202nd St
- 100-28 207th St
- 204-06 109th Ave
- 104-38 202nd St
- 104-28 201st St
- 20202 109th Ave
- 10411 200th St
- 109-10 Francis Lewis Blvd
- 109-12 Francis Lewis Blvd
- 99-03 207th St
- 109-18 Francis Lewis Blvd
- 100-32 199th St
- 93-45 202nd St
- 109-15 200th St
- 104-39 199th St
- 208-17 100th Ave
- 10033 204th St
- 10029 204th St
- 10039 204th St
- 10027 204th St
- 10039 204th St
- 10023 204th St
- 10032 205th St
- 10036 205th St
- 10043 204th St
- 10028 205th St
- 10040 205th St
- 10040 205th St
- 10040 205th St
- 10026 205th St
- 10019 204th St
- 10019 204th St
- 10019 204th St Unit 2nd Fl
- 10044 205th St
- 10047 204th St
- 10022 205th St