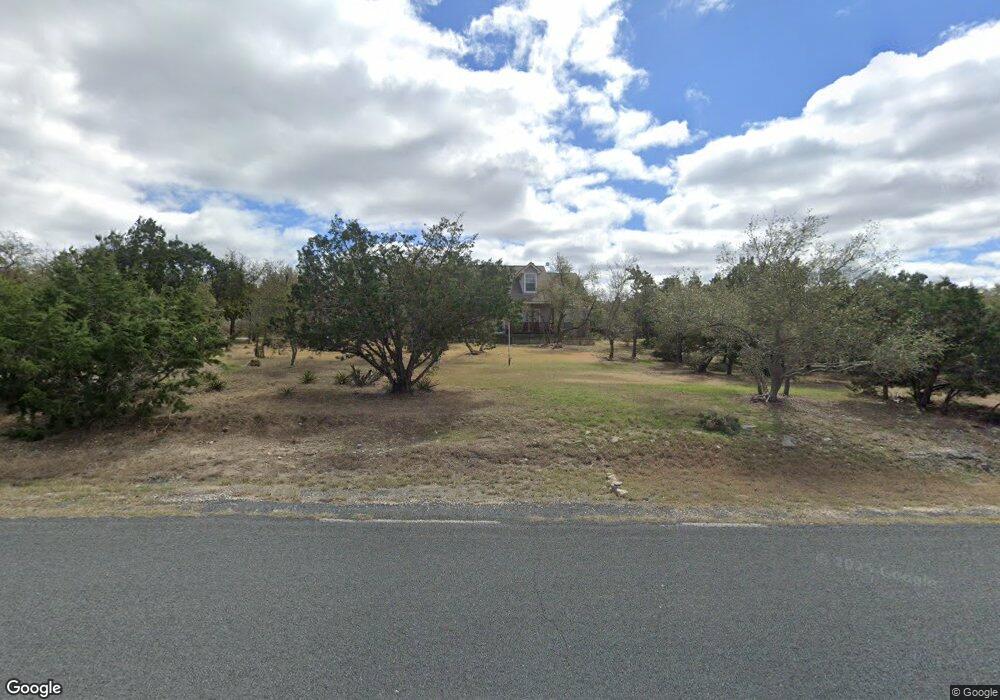
10033 W Cave Loop Dripping Springs, TX 78620
Hamilton Pool NeighborhoodEstimated Value: $589,000 - $734,000
4
Beds
2
Baths
2,309
Sq Ft
$285/Sq Ft
Est. Value
About This Home
This home is located at 10033 W Cave Loop, Dripping Springs, TX 78620 and is currently estimated at $657,339, approximately $284 per square foot. 10033 W Cave Loop is a home located in Travis County with nearby schools including Bee Cave Elementary School, Bee Cave Middle School, and Lake Travis High School.
Ownership History
Date
Name
Owned For
Owner Type
Purchase Details
Closed on
Nov 30, 2009
Sold by
Gorzycki Kenneth A and Gorzycki Martha K
Bought by
Erickson Edward E and Erickson Carolyn M
Current Estimated Value
Purchase Details
Closed on
Jul 7, 2001
Sold by
Cedar Creek Homes Inc
Bought by
Gorzycki Kenneth A and Gorzycki Martha K
Home Financials for this Owner
Home Financials are based on the most recent Mortgage that was taken out on this home.
Original Mortgage
$199,200
Interest Rate
7.16%
Mortgage Type
Purchase Money Mortgage
Purchase Details
Closed on
Apr 26, 2000
Sold by
Tortuga Land Company
Bought by
Cedar Creek Homes Inc
Home Financials for this Owner
Home Financials are based on the most recent Mortgage that was taken out on this home.
Original Mortgage
$10,800
Interest Rate
8.19%
Mortgage Type
Seller Take Back
Create a Home Valuation Report for This Property
The Home Valuation Report is an in-depth analysis detailing your home's value as well as a comparison with similar homes in the area
Home Values in the Area
Average Home Value in this Area
Purchase History
| Date | Buyer | Sale Price | Title Company |
|---|---|---|---|
| Erickson Edward E | -- | Gracy Title Company | |
| Gorzycki Kenneth A | -- | Texas Professional Title Inc | |
| Cedar Creek Homes Inc | -- | Austin Title Company |
Source: Public Records
Mortgage History
| Date | Status | Borrower | Loan Amount |
|---|---|---|---|
| Previous Owner | Gorzycki Kenneth A | $199,200 | |
| Previous Owner | Cedar Creek Homes Inc | $10,800 |
Source: Public Records
Tax History Compared to Growth
Tax History
| Year | Tax Paid | Tax Assessment Tax Assessment Total Assessment is a certain percentage of the fair market value that is determined by local assessors to be the total taxable value of land and additions on the property. | Land | Improvement |
|---|---|---|---|---|
| 2025 | $2,027 | $513,740 | $211,200 | $302,540 |
| 2023 | $1,800 | $436,862 | $0 | $0 |
| 2022 | $6,814 | $397,147 | $0 | $0 |
| 2021 | $6,496 | $361,043 | $47,520 | $381,803 |
| 2020 | $6,277 | $328,221 | $47,520 | $280,701 |
| 2018 | $5,989 | $301,907 | $47,520 | $254,387 |
| 2017 | $5,997 | $299,568 | $47,520 | $252,048 |
| 2016 | $5,618 | $280,618 | $31,680 | $248,938 |
| 2015 | $3,268 | $268,430 | $31,680 | $244,062 |
| 2014 | $3,268 | $244,027 | $0 | $0 |
Source: Public Records
Map
Nearby Homes
- 10215 Hill Country Skyline
- 18220 Shepherds Corral
- 112 Twin Saddles Ln
- 10103 Twin Lake Loop
- 18009 Linkhill Dr
- 10105 Twin Lake Loop
- 18003 Linkhill Dr
- 10033 Longhorn Skyway
- 10113 Longhorn Skyway
- 10115 Longhorn Skyway
- 17912 Turkey Trot Trail
- 17610 Village Dr
- 10129 Longhorn Skyway
- 17811 Mason Dixon Cir
- 17601 Lake Shore Dr
- 10978 W Cave Blvd
- 17408 Avion Dr
- 17503 Lake Shore Dr
- 203 Stirrup Dr
- 0 Westward Look
- 10029 W Cave Loop
- 10037 W Cave Loop
- 10224 Hill Country Skyline
- 10216 Hill Country Skyline
- 10516 Hill Country Skyline
- 10041 W Cave Loop
- 10212 Creek Crossing Cove
- 18601 Surveyors Crossing
- 18501 Surveyors Crossing
- 10208 Hill Country Skyline
- 10301 Hill Country Skyline
- 10310 Hill Country Skyline
- 10225 Hill Country Skyline
- 10045 W Cave Loop
- 10208 Creek Crossing Cove
- 10009 W Cave Loop
- 10400 Hill Country Skyline
- 10205 Creek Crossing Cove
- 18401 Surveyors Crossing