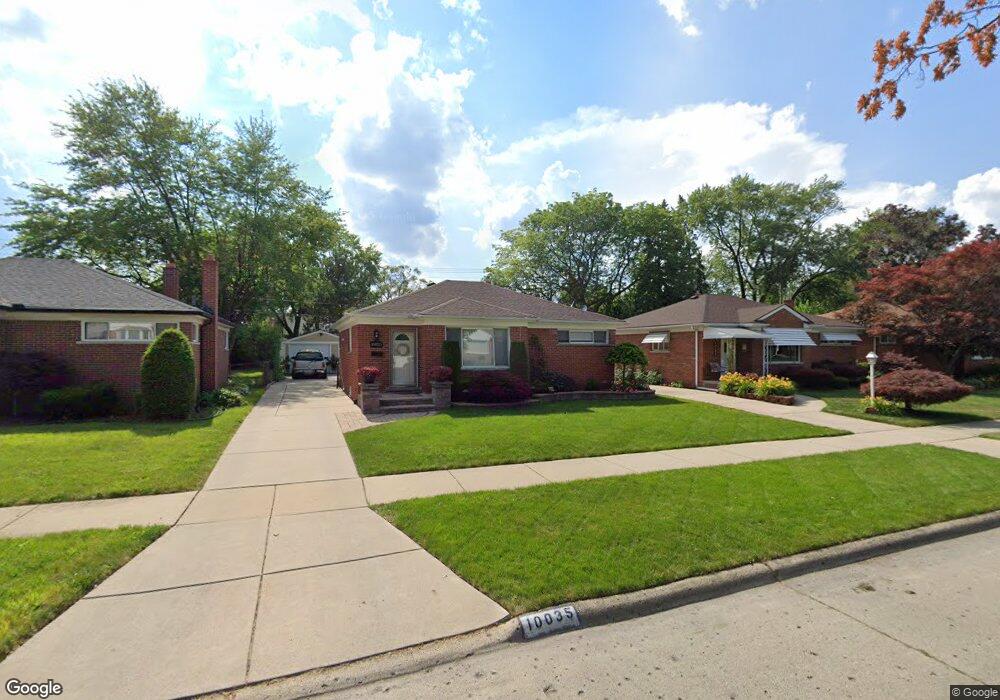
10035 Brady Redford, MI 48239
Estimated Value: $197,189 - $213,000
3
Beds
1
Bath
1,252
Sq Ft
$164/Sq Ft
Est. Value
About This Home
This home is located at 10035 Brady, Redford, MI 48239 and is currently estimated at $205,547, approximately $164 per square foot. 10035 Brady is a home located in Wayne County with nearby schools including John D. Pierce Middle School, Lee M. Thurston High School, and Washington-Parks Academy.
Ownership History
Date
Name
Owned For
Owner Type
Purchase Details
Closed on
Mar 20, 2018
Sold by
Ochoa Luis and Ochoa Gillberto
Bought by
Gonzalez Jorge Ochoa
Current Estimated Value
Purchase Details
Closed on
May 23, 2008
Sold by
Mortgage Electronic Registration Systems
Bought by
Gmac Mortgage Llc
Purchase Details
Closed on
Feb 13, 2008
Sold by
Austin Sabrina J
Bought by
Mortgage Electronic Registration Systems
Purchase Details
Closed on
Aug 26, 2005
Sold by
Freismuth Freismuth Kenneth J Kenneth J and Freismuth Hidey Patricia
Bought by
Austin Sabrina J
Purchase Details
Closed on
Mar 27, 1996
Sold by
Kenneth J Freismuth & Pa
Bought by
Mallad Reyad R and Mallad Sahar
Purchase Details
Closed on
Sep 16, 1994
Sold by
Lake Erie Ptns
Bought by
Reyad R Mallad
Home Financials for this Owner
Home Financials are based on the most recent Mortgage that was taken out on this home.
Original Mortgage
$79,650
Interest Rate
8.6%
Mortgage Type
FHA
Create a Home Valuation Report for This Property
The Home Valuation Report is an in-depth analysis detailing your home's value as well as a comparison with similar homes in the area
Home Values in the Area
Average Home Value in this Area
Purchase History
| Date | Buyer | Sale Price | Title Company |
|---|---|---|---|
| Gonzalez Jorge Ochoa | -- | None Available | |
| Gmac Mortgage Llc | -- | None Available | |
| Mortgage Electronic Registration Systems | $100,300 | None Available | |
| Austin Sabrina J | $155,900 | Multiple | |
| Mallad Reyad R | $99,000 | -- | |
| Reyad R Mallad | $79,900 | -- |
Source: Public Records
Mortgage History
| Date | Status | Borrower | Loan Amount |
|---|---|---|---|
| Previous Owner | Reyad R Mallad | $79,650 |
Source: Public Records
Tax History
| Year | Tax Paid | Tax Assessment Tax Assessment Total Assessment is a certain percentage of the fair market value that is determined by local assessors to be the total taxable value of land and additions on the property. | Land | Improvement |
|---|---|---|---|---|
| 2025 | $823 | $93,600 | $0 | $0 |
| 2024 | $801 | $85,600 | $0 | $0 |
| 2023 | $767 | $77,100 | $0 | $0 |
| 2022 | $2,248 | $65,500 | $0 | $0 |
| 2021 | $2,185 | $61,900 | $0 | $0 |
| 2020 | $2,155 | $55,600 | $0 | $0 |
| 2019 | $2,109 | $50,100 | $0 | $0 |
| 2018 | $963 | $39,800 | $0 | $0 |
| 2017 | $2,389 | $37,100 | $0 | $0 |
| 2016 | $1,862 | $34,400 | $0 | $0 |
| 2015 | $2,901 | $31,800 | $0 | $0 |
| 2013 | $2,810 | $28,700 | $0 | $0 |
| 2012 | $1,788 | $31,600 | $7,600 | $24,000 |
Source: Public Records
Map
Nearby Homes
Your Personal Tour Guide
Ask me questions while you tour the home.