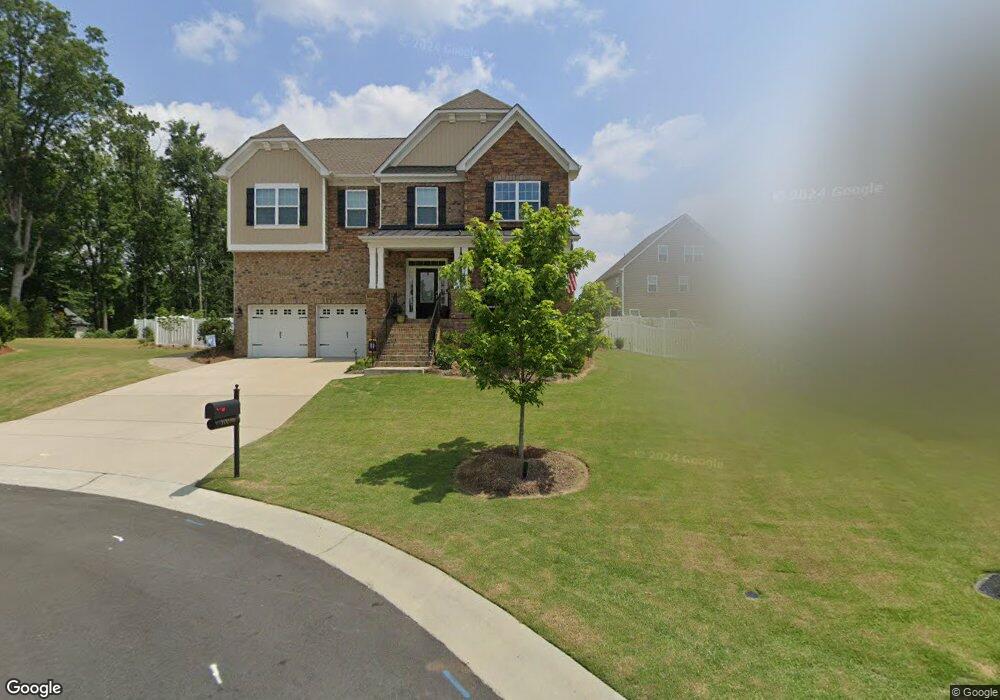
10038 Travertine Trail Unit 71 Davidson, NC 28036
Estimated Value: $658,306 - $734,000
5
Beds
5
Baths
3,551
Sq Ft
$200/Sq Ft
Est. Value
About This Home
This home is located at 10038 Travertine Trail Unit 71, Davidson, NC 28036 and is currently estimated at $710,327, approximately $200 per square foot. 10038 Travertine Trail Unit 71 is a home with nearby schools including W.R. Odell Elementary School, Harris Road Middle, and Northwest Cabarrus High.
Ownership History
Date
Name
Owned For
Owner Type
Purchase Details
Closed on
Jun 9, 2021
Sold by
Lewis Craig A and Devine Karla K
Bought by
Winningham Richard Scott and Gavillan Carley Lynn
Current Estimated Value
Home Financials for this Owner
Home Financials are based on the most recent Mortgage that was taken out on this home.
Original Mortgage
$429,600
Outstanding Balance
$388,949
Interest Rate
2.9%
Mortgage Type
New Conventional
Estimated Equity
$321,378
Purchase Details
Closed on
Dec 4, 2017
Sold by
Devine Karla K
Bought by
Devine Karla K and Lewis Craig A
Purchase Details
Closed on
Apr 24, 2015
Sold by
Lennar Carolinas Llc
Bought by
Devine Karla K
Home Financials for this Owner
Home Financials are based on the most recent Mortgage that was taken out on this home.
Original Mortgage
$277,200
Interest Rate
3.62%
Mortgage Type
Adjustable Rate Mortgage/ARM
Create a Home Valuation Report for This Property
The Home Valuation Report is an in-depth analysis detailing your home's value as well as a comparison with similar homes in the area
Home Values in the Area
Average Home Value in this Area
Purchase History
| Date | Buyer | Sale Price | Title Company |
|---|---|---|---|
| Winningham Richard Scott | $537,000 | None Available | |
| Devine Karla K | -- | None Available | |
| Devine Karla K | $308,000 | None Available |
Source: Public Records
Mortgage History
| Date | Status | Borrower | Loan Amount |
|---|---|---|---|
| Open | Winningham Richard Scott | $429,600 | |
| Previous Owner | Devine Karla K | $277,200 |
Source: Public Records
Tax History
| Year | Tax Paid | Tax Assessment Tax Assessment Total Assessment is a certain percentage of the fair market value that is determined by local assessors to be the total taxable value of land and additions on the property. | Land | Improvement |
|---|---|---|---|---|
| 2025 | $6,601 | $581,310 | $114,000 | $467,310 |
| 2024 | $6,601 | $581,310 | $114,000 | $467,310 |
| 2023 | $5,160 | $376,660 | $75,000 | $301,660 |
| 2022 | $5,160 | $367,150 | $75,000 | $292,150 |
| 2021 | $5,030 | $367,150 | $75,000 | $292,150 |
| 2020 | $5,030 | $367,150 | $75,000 | $292,150 |
| 2019 | $4,294 | $313,400 | $44,000 | $269,400 |
| 2018 | $4,231 | $313,400 | $44,000 | $269,400 |
| 2017 | $4,168 | $313,400 | $44,000 | $269,400 |
| 2016 | $4,168 | $201,030 | $55,000 | $146,030 |
Source: Public Records
Map
Nearby Homes
- 2921 Vista End Trail
- 10666 Sapphire Trail
- 10008 Manor Vista Trail
- 10004 Manor Vista Trail
- 10000 Manor Vista Trail
- 9996 Manor Vista Trail
- 1982 Smokey Quartz Rd
- 9992 Manor Vista Trail
- 9988 Manor Vista Trail
- 2870 Shale Dr
- 10997 Alabaster Dr
- 9890 Travertine Trail
- 3344 Shiloh Church Rd
- 2600 Shiloh Church Rd
- 2580 Shiloh Church Rd
- 9905 Emerson Glen Dr
- 2423 Jim Johnson Rd
- 3000 Ballenger St
- 2980 Ballenger St
- 2725 Pinecliff Dr
- 10038 Travertine Trail
- 10034 Travertine Trail
- 10042 Travertine Trail
- 2071 Feldspar Dr Unit 68
- 2071 Feldspar Dr
- 2077 Feldspar Dr Unit 69
- 10041 Travertine Trail
- 10045 Travertine Trail
- 10037 Travertine Trail
- 2074 Feldspar Dr
- 10026 Travertine Trail Unit 66
- 10033 Travertine Trail
- 2070 Feldspar Dr Unit 64
- 2066 Feldspar Dr
- 10029 Travertine Trail
- 2081 Feldspar Dr
- 2081 Feldspar Dr Unit 70
- 10022 Travertine Trail
- 2078 Feldspar Dr
- 10201 Alabaster Dr
Your Personal Tour Guide
Ask me questions while you tour the home.