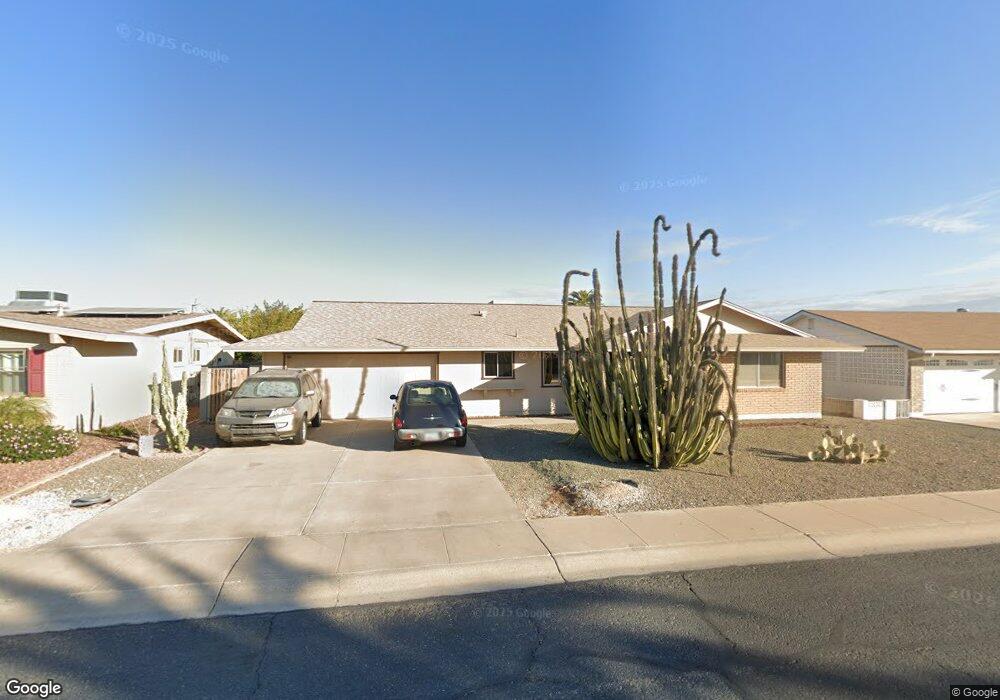
10038 W Cumberland Dr Sun City, AZ 85351
Estimated Value: $232,120 - $282,000
2
Beds
2
Baths
1,413
Sq Ft
$187/Sq Ft
Est. Value
About This Home
This home is located at 10038 W Cumberland Dr, Sun City, AZ 85351 and is currently estimated at $264,530, approximately $187 per square foot. 10038 W Cumberland Dr is a home located in Maricopa County with nearby schools including Ombudsman - Northwest Charter and Peoria Accelerated High School.
Ownership History
Date
Name
Owned For
Owner Type
Purchase Details
Closed on
Oct 4, 2016
Sold by
Searles Joan Marie
Bought by
Box Lisa Marie
Current Estimated Value
Home Financials for this Owner
Home Financials are based on the most recent Mortgage that was taken out on this home.
Original Mortgage
$102,000
Outstanding Balance
$81,668
Interest Rate
3.42%
Mortgage Type
New Conventional
Estimated Equity
$182,862
Purchase Details
Closed on
Oct 8, 2008
Sold by
Searlies Joan Marie
Bought by
Searles Joan Marie and The Joan Marie Searles Living Trust
Purchase Details
Closed on
Dec 8, 2004
Sold by
Searles Lon Frank and Searles Rebecca
Bought by
Searles Joan Marie
Purchase Details
Closed on
May 5, 2004
Sold by
Tollefson La Verne N and Tollefson Judith A
Bought by
Searles Lon Frank and Searles Rebecca
Purchase Details
Closed on
Aug 30, 2000
Sold by
Nazario Ernest
Bought by
Tollefson La Verne N and Tollefson Judith A
Create a Home Valuation Report for This Property
The Home Valuation Report is an in-depth analysis detailing your home's value as well as a comparison with similar homes in the area
Home Values in the Area
Average Home Value in this Area
Purchase History
| Date | Buyer | Sale Price | Title Company |
|---|---|---|---|
| Box Lisa Marie | $132,900 | First American Title Ins Co | |
| Searles Joan Marie | -- | None Available | |
| Searles Joan Marie | -- | Chicago Title Insurance Co | |
| Searles Lon Frank | $124,500 | Chicago Title Insurance Comp | |
| Tollefson La Verne N | $60,000 | Chicago Title Insurance Co |
Source: Public Records
Mortgage History
| Date | Status | Borrower | Loan Amount |
|---|---|---|---|
| Open | Box Lisa Marie | $102,000 |
Source: Public Records
Tax History Compared to Growth
Tax History
| Year | Tax Paid | Tax Assessment Tax Assessment Total Assessment is a certain percentage of the fair market value that is determined by local assessors to be the total taxable value of land and additions on the property. | Land | Improvement |
|---|---|---|---|---|
| 2025 | $893 | $10,981 | -- | -- |
| 2024 | $800 | $10,458 | -- | -- |
| 2023 | $800 | $20,450 | $4,090 | $16,360 |
| 2022 | $748 | $16,000 | $3,200 | $12,800 |
| 2021 | $773 | $14,900 | $2,980 | $11,920 |
| 2020 | $753 | $13,120 | $2,620 | $10,500 |
| 2019 | $748 | $11,970 | $2,390 | $9,580 |
| 2018 | $723 | $10,680 | $2,130 | $8,550 |
| 2017 | $701 | $9,360 | $1,870 | $7,490 |
| 2016 | $654 | $8,800 | $1,760 | $7,040 |
| 2015 | $624 | $7,880 | $1,570 | $6,310 |
Source: Public Records
Map
Nearby Homes
- 10034 W Concord Ave
- 10131 W Cheryl Dr Unit 6D
- 9939 W Ironwood Dr Unit 6D
- 10166 W Cinnebar Ave
- 9891 N Balboa Dr
- 10240 W Concord Ave
- 9834 N Balboa Dr
- 10027 W Tarrytown Ave Unit 6
- 10302 W Cheryl Dr Unit D
- 10201 N 99th Ave Unit 3
- 10201 N 99th Ave Unit 33
- 10201 N 99th Ave Unit 149
- 10201 N 99th Ave Unit 2
- 10201 N 99th Ave Unit 96
- 10201 N 99th Ave Unit 28A
- 10201 N 99th Ave Unit 32A
- 10201 N 99th Ave Unit 49
- 10201 N 99th Ave Unit 66
- 10201 N 99th Ave Unit 34
- 10201 N 99th Ave Unit 21
- 10034 W Cumberland Dr
- 10044 W Cumberland Dr
- 10039 W Andover Ave
- 10033 W Andover Ave
- 10045 W Andover Ave
- 10037 W Cumberland Dr
- 10026 W Cumberland Dr
- 10043 W Cumberland Dr
- 10027 W Andover Ave Unit 6
- 10033 W Cumberland Dr
- 10025 W Cumberland Dr
- 10102 W Cumberland Dr
- 10020 W Cumberland Dr
- 10021 W Andover Ave
- 10101 W Andover Ave Unit 6
- 9855 N 101st Ave
- 10040 W Andover Ave
- 10034 W Andover Ave
- 10046 W Andover Ave
- 10019 W Cumberland Dr