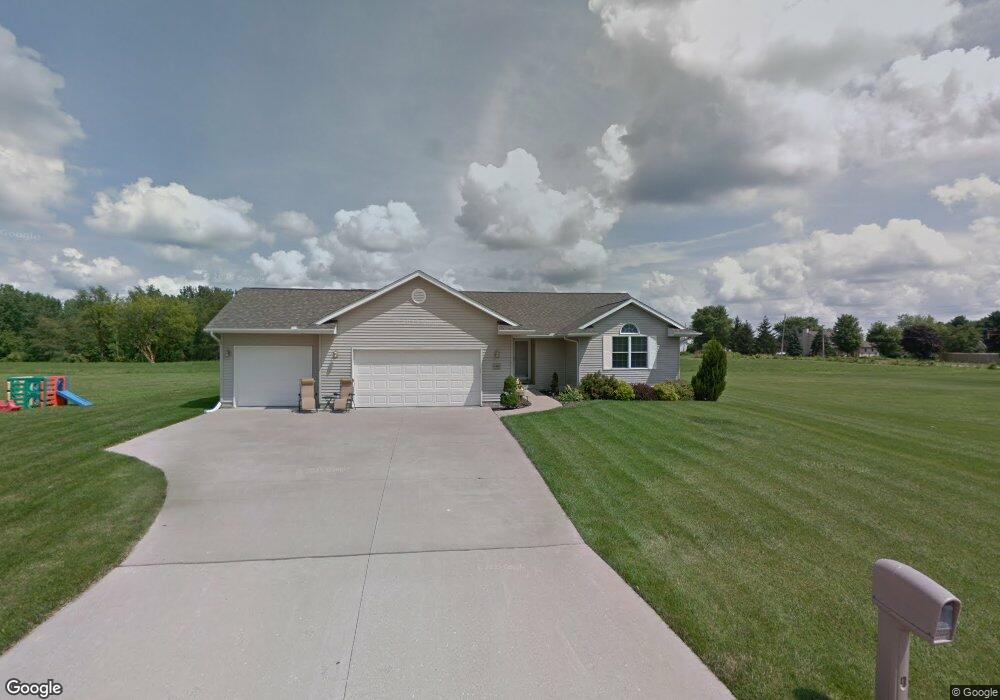
1004 13th St Port Byron, IL 61275
Estimated Value: $321,989 - $388,000
Studio
--
Bath
1,564
Sq Ft
$222/Sq Ft
Est. Value
About This Home
This home is located at 1004 13th St, Port Byron, IL 61275 and is currently estimated at $346,663, approximately $221 per square foot. 1004 13th St is a home located in Rock Island County with nearby schools including Riverdale Elementary School, Riverdale Middle School, and Riverdale Senior High School.
Ownership History
Date
Name
Owned For
Owner Type
Purchase Details
Closed on
Aug 24, 2020
Sold by
Oney Shane L and Oney Andrea T
Bought by
Krier Brian Richard and Krier Lena Marie
Current Estimated Value
Home Financials for this Owner
Home Financials are based on the most recent Mortgage that was taken out on this home.
Original Mortgage
$265,500
Outstanding Balance
$237,648
Interest Rate
3.5%
Mortgage Type
New Conventional
Estimated Equity
$109,015
Create a Home Valuation Report for This Property
The Home Valuation Report is an in-depth analysis detailing your home's value as well as a comparison with similar homes in the area
Home Values in the Area
Average Home Value in this Area
Purchase History
| Date | Buyer | Sale Price | Title Company |
|---|---|---|---|
| Krier Brian Richard | $295,000 | Gomez Title |
Source: Public Records
Mortgage History
| Date | Status | Borrower | Loan Amount |
|---|---|---|---|
| Open | Krier Brian Richard | $265,500 |
Source: Public Records
Tax History
| Year | Tax Paid | Tax Assessment Tax Assessment Total Assessment is a certain percentage of the fair market value that is determined by local assessors to be the total taxable value of land and additions on the property. | Land | Improvement |
|---|---|---|---|---|
| 2024 | $7,113 | $100,959 | $4,224 | $96,735 |
| 2023 | $7,113 | $94,620 | $3,959 | $90,661 |
| 2022 | $6,193 | $86,021 | $3,599 | $82,422 |
| 2021 | $6,074 | $82,238 | $3,441 | $78,797 |
| 2020 | $5,991 | $81,183 | $3,397 | $77,786 |
| 2019 | $5,900 | $79,708 | $3,335 | $76,373 |
| 2018 | $5,378 | $74,496 | $13,798 | $60,698 |
| 2017 | $5,197 | $73,107 | $13,541 | $59,566 |
| 2016 | $5,187 | $72,744 | $13,474 | $59,270 |
| 2015 | $4,944 | $69,027 | $12,786 | $56,241 |
| 2014 | -- | $67,296 | $12,465 | $54,831 |
| 2013 | -- | $67,296 | $12,465 | $54,831 |
Source: Public Records
Map
Nearby Homes
Your Personal Tour Guide
Ask me questions while you tour the home.