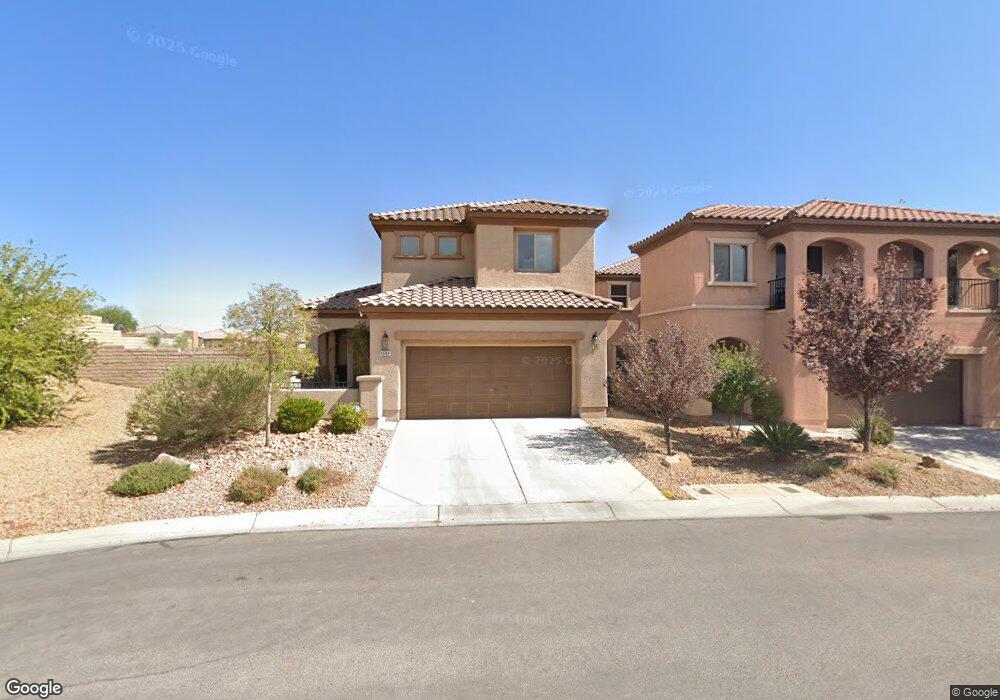
1004 Calvia St Las Vegas, NV 89138
Estimated Value: $562,000 - $611,000
3
Beds
3
Baths
1,719
Sq Ft
$339/Sq Ft
Est. Value
About This Home
This home is located at 1004 Calvia St, Las Vegas, NV 89138 and is currently estimated at $583,369, approximately $339 per square foot. 1004 Calvia St is a home located in Clark County with nearby schools including Billy And Rosemary Vassiliadis Elementary School, Sig Rogich Middle School, and Palo Verde High School.
Ownership History
Date
Name
Owned For
Owner Type
Purchase Details
Closed on
Oct 16, 2020
Sold by
Liu Shu Hui
Bought by
Shu Hui Liu Revocable Trust
Current Estimated Value
Purchase Details
Closed on
Dec 10, 2009
Sold by
Federal National Mortgage Association
Bought by
Liu Shu Hui
Home Financials for this Owner
Home Financials are based on the most recent Mortgage that was taken out on this home.
Original Mortgage
$101,000
Outstanding Balance
$65,912
Interest Rate
4.91%
Mortgage Type
New Conventional
Estimated Equity
$517,457
Purchase Details
Closed on
Feb 10, 2009
Sold by
Alderson Craig
Bought by
Federal National Mortgage Association
Purchase Details
Closed on
Jul 12, 2005
Sold by
Pulte Homes Corp
Bought by
Alderson Craig
Home Financials for this Owner
Home Financials are based on the most recent Mortgage that was taken out on this home.
Original Mortgage
$359,650
Interest Rate
5.55%
Mortgage Type
Fannie Mae Freddie Mac
Create a Home Valuation Report for This Property
The Home Valuation Report is an in-depth analysis detailing your home's value as well as a comparison with similar homes in the area
Home Values in the Area
Average Home Value in this Area
Purchase History
| Date | Buyer | Sale Price | Title Company |
|---|---|---|---|
| Shu Hui Liu Revocable Trust | -- | None Available | |
| Liu Shu Hui | $204,750 | Lawyers Title Of Nevada Cen | |
| Federal National Mortgage Association | $306,408 | First American Title Ins Co | |
| Alderson Craig | $386,500 | Lawyers Title Of Nevada |
Source: Public Records
Mortgage History
| Date | Status | Borrower | Loan Amount |
|---|---|---|---|
| Open | Liu Shu Hui | $101,000 | |
| Previous Owner | Alderson Craig | $359,650 |
Source: Public Records
Tax History Compared to Growth
Tax History
| Year | Tax Paid | Tax Assessment Tax Assessment Total Assessment is a certain percentage of the fair market value that is determined by local assessors to be the total taxable value of land and additions on the property. | Land | Improvement |
|---|---|---|---|---|
| 2025 | $3,042 | $140,222 | $56,963 | $83,259 |
| 2024 | $2,817 | $140,222 | $56,963 | $83,259 |
| 2023 | $1,995 | $120,193 | $41,895 | $78,298 |
| 2022 | $2,609 | $104,756 | $33,075 | $71,681 |
| 2021 | $2,414 | $99,986 | $31,973 | $68,013 |
| 2020 | $2,239 | $99,930 | $32,708 | $67,222 |
| 2019 | $2,172 | $92,420 | $26,460 | $65,960 |
| 2018 | $2,106 | $86,418 | $23,153 | $63,265 |
| 2017 | $2,814 | $85,644 | $21,683 | $63,961 |
| 2016 | $1,995 | $80,804 | $16,905 | $63,899 |
| 2015 | $1,991 | $64,254 | $13,230 | $51,024 |
| 2014 | $1,932 | $56,968 | $8,820 | $48,148 |
Source: Public Records
Map
Nearby Homes
- 845 Canterra St Unit 2051
- 860 Canterra St Unit 1036
- 11865 Tevare Ln Unit 1079
- 875 Pantara Place Unit 1003
- 11848 Orense Dr
- 1064 Calvia St
- 840 Paseo Rocoso Place
- 11620 Longhirst Hall Ln
- 841 Colina Alta Place
- 11832 Arenoso Dr
- 1020 Puerta Del Sol Dr
- 12020 Prada Verde Dr
- 873 Roseberry Dr
- 11904 Amistoso Ln
- 776 Anacapri St
- 11925 Luna Del Mar Ln
- 11625 Cabo Del Verde Ave
- 716 Chervil Valley Dr
- 11731 Longworth Rd
- 11745 Via Esperanza Ave
- 1008 Calvia St
- 1012 Calvia St
- 11812 Bussero Ct
- 11816 Bussero Ct
- 860 Canterra St Unit 2039
- 860 Canterra St Unit 2034
- 860 Canterra St Unit 1035
- 860 Canterra St Unit 2036
- 860 Canterra St Unit 1038
- 860 Canterra St Unit 2035
- 860 Canterra St Unit 2038
- 860 Canterra St Unit 2037
- 860 Canterra St Unit 1037
- 11813 Bussero Ct
- 1020 Calvia St
- 11820 Bussero Ct
- 11817 Bussero Ct
- 1024 Calvia St
- 945 Purdy Lodge St