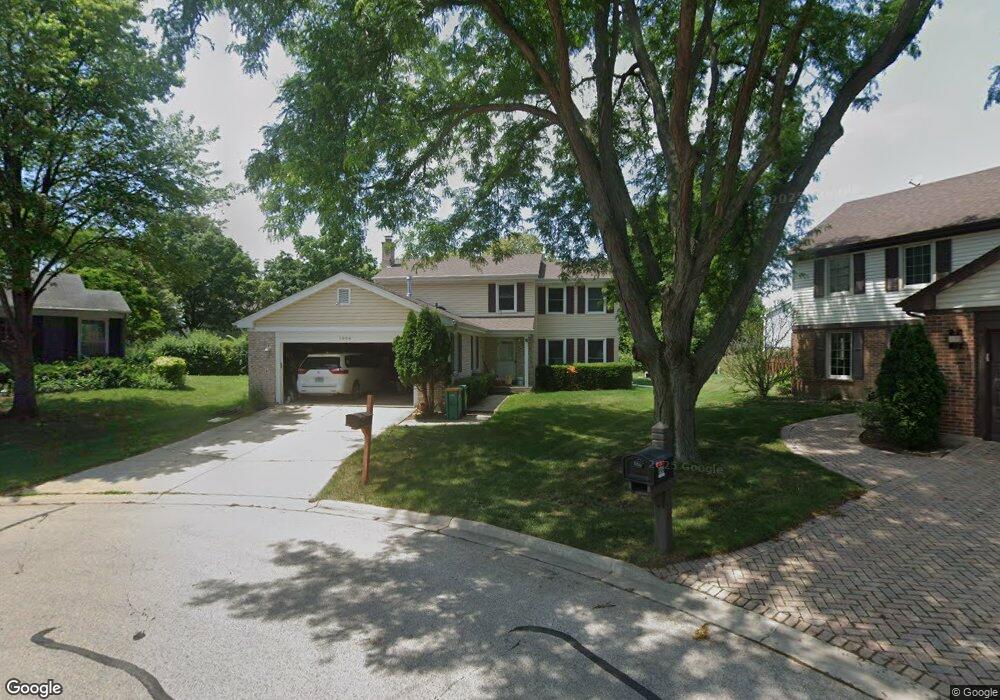
1004 Cooper Ct Buffalo Grove, IL 60089
Estimated Value: $480,666 - $558,000
--
Bed
3
Baths
1,940
Sq Ft
$264/Sq Ft
Est. Value
About This Home
This home is located at 1004 Cooper Ct, Buffalo Grove, IL 60089 and is currently estimated at $511,917, approximately $263 per square foot. 1004 Cooper Ct is a home located in Lake County with nearby schools including Kildeer Countryside Elementary School, Woodlawn Middle School, and Adlai E Stevenson High School.
Ownership History
Date
Name
Owned For
Owner Type
Purchase Details
Closed on
Mar 2, 2023
Sold by
Guo Qiyu and Liang Weilong
Bought by
Qiyu Guo And Weilong Liang Revocable Trust and Guo
Current Estimated Value
Purchase Details
Closed on
Nov 14, 2000
Sold by
Sherwood Craig P and Sherwood Joi A
Bought by
Guo Qiyu and Liang Weilong
Home Financials for this Owner
Home Financials are based on the most recent Mortgage that was taken out on this home.
Original Mortgage
$236,800
Interest Rate
7.87%
Purchase Details
Closed on
Sep 9, 1998
Sold by
Romig Keith W and Romig Carolyn
Bought by
Sherwood Craig P and Sherwood Joi A
Home Financials for this Owner
Home Financials are based on the most recent Mortgage that was taken out on this home.
Original Mortgage
$150,000
Interest Rate
7.02%
Create a Home Valuation Report for This Property
The Home Valuation Report is an in-depth analysis detailing your home's value as well as a comparison with similar homes in the area
Home Values in the Area
Average Home Value in this Area
Purchase History
| Date | Buyer | Sale Price | Title Company |
|---|---|---|---|
| Qiyu Guo And Weilong Liang Revocable Trust | -- | None Listed On Document | |
| Guo Qiyu | $296,000 | -- | |
| Sherwood Craig P | $225,000 | First American Title |
Source: Public Records
Mortgage History
| Date | Status | Borrower | Loan Amount |
|---|---|---|---|
| Previous Owner | Guo Qiyu | $236,800 | |
| Previous Owner | Sherwood Craig P | $150,000 | |
| Closed | Guo Qiyu | $29,600 |
Source: Public Records
Tax History Compared to Growth
Tax History
| Year | Tax Paid | Tax Assessment Tax Assessment Total Assessment is a certain percentage of the fair market value that is determined by local assessors to be the total taxable value of land and additions on the property. | Land | Improvement |
|---|---|---|---|---|
| 2024 | $11,905 | $135,421 | $38,645 | $96,776 |
| 2023 | $11,305 | $124,057 | $35,402 | $88,655 |
| 2022 | $11,305 | $114,421 | $32,652 | $81,769 |
| 2021 | $10,876 | $113,187 | $32,300 | $80,887 |
| 2020 | $10,620 | $113,573 | $32,410 | $81,163 |
| 2019 | $10,475 | $113,155 | $32,291 | $80,864 |
| 2018 | $5,711 | $118,625 | $31,913 | $86,712 |
| 2017 | $10,465 | $115,856 | $31,168 | $84,688 |
| 2016 | $10,189 | $110,941 | $29,846 | $81,095 |
| 2015 | $9,915 | $103,751 | $27,912 | $75,839 |
| 2014 | $9,814 | $101,360 | $29,978 | $71,382 |
| 2012 | $9,510 | $101,563 | $30,038 | $71,525 |
Source: Public Records
Map
Nearby Homes
- 887 Saybrook Ln Unit 2
- 1325 Fairfax Ln
- 1324 Fairfax Ln Unit B32
- 1514 Sumter Dr
- 1357 Bristol Ln Unit Q4
- 12 Cloverdale Ct
- 1545 Chickamauga Ln
- 5107 N Arlington Heights Rd
- 1032 Courtland Dr Unit 9
- 800 Clohesey Dr
- 1242 Antietam Dr
- 950 Belmar Ln
- 1728 Holly Ct
- 1141 Devonshire Rd
- 931 Shady Grove Ln
- 890 Knollwood Dr
- 1265 Devonshire Rd
- 610 Checker Dr
- 221 Thornapple Ct
- 1112 Auburn Ln
- 996 Cooper Ct
- 1490 Chase Ct
- 1476 Chase Ct Unit 4
- 988 Cooper Ct
- 1043 Shambliss Ct
- 1041 Shambliss Ct Unit 3
- 1041 Shambliss Ct Unit 1
- 997 Cooper Ct
- 1462 Chase Ct
- 987 Cooper Ct
- 980 Cooper Ct Unit 4
- 957 Cooper Ct
- 1501 Bunescu Ln
- 1045 Shambliss Ct
- 1039 Shambliss Ct
- 1491 Chase Ct
- 1075 Shambliss Ln
- 949 Cooper Ct
- 1513 Bunescu Ln
- 972 Cooper Ct