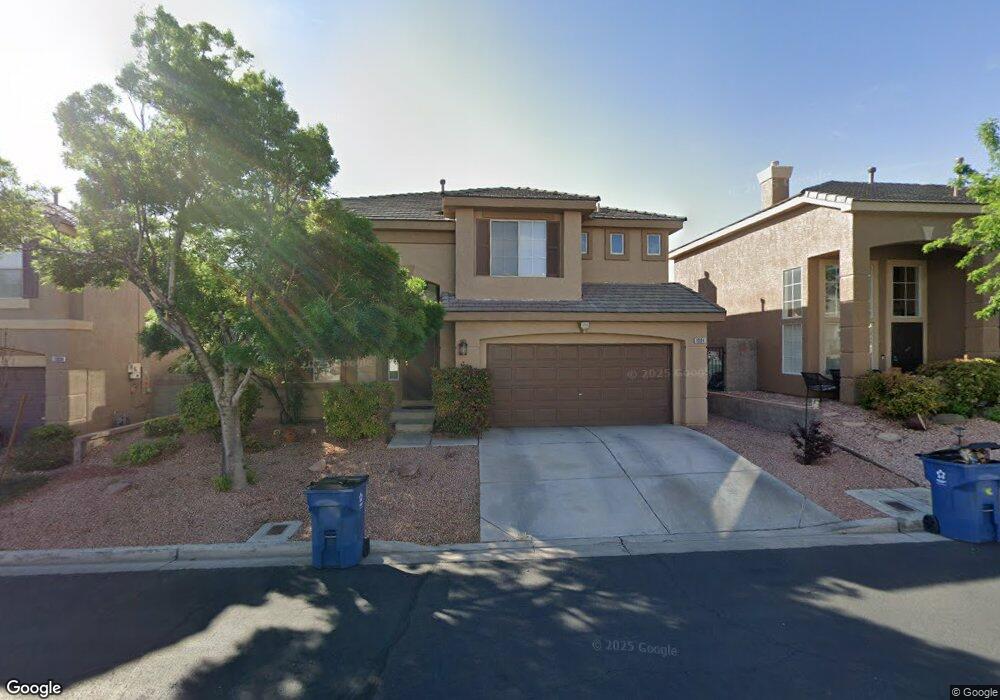
1004 Corsica Ln Las Vegas, NV 89144
Summerlin NeighborhoodEstimated Value: $552,333 - $566,000
3
Beds
3
Baths
1,922
Sq Ft
$291/Sq Ft
Est. Value
About This Home
This home is located at 1004 Corsica Ln, Las Vegas, NV 89144 and is currently estimated at $558,833, approximately $290 per square foot. 1004 Corsica Ln is a home located in Clark County with nearby schools including John W. Bonner Elementary School, Sig Rogich Middle School, and Palo Verde High School.
Ownership History
Date
Name
Owned For
Owner Type
Purchase Details
Closed on
Sep 6, 2011
Sold by
Banes John D
Bought by
Jdb Trust
Current Estimated Value
Purchase Details
Closed on
Jun 15, 2011
Sold by
E Trade Bank
Bought by
Banes John D
Purchase Details
Closed on
Apr 26, 2011
Sold by
Park Jae R
Bought by
E*Trade Bank
Purchase Details
Closed on
Feb 9, 2005
Sold by
Santamaria Emilio R and Santamaria Susana T
Bought by
Park Jae R
Home Financials for this Owner
Home Financials are based on the most recent Mortgage that was taken out on this home.
Original Mortgage
$270,400
Interest Rate
5.81%
Mortgage Type
Unknown
Purchase Details
Closed on
Jan 4, 2000
Sold by
Cross N and Cross Banburry Cross
Bought by
Santamaria Emilio R and Santamaria Susana T
Home Financials for this Owner
Home Financials are based on the most recent Mortgage that was taken out on this home.
Original Mortgage
$118,300
Interest Rate
7.72%
Create a Home Valuation Report for This Property
The Home Valuation Report is an in-depth analysis detailing your home's value as well as a comparison with similar homes in the area
Home Values in the Area
Average Home Value in this Area
Purchase History
| Date | Buyer | Sale Price | Title Company |
|---|---|---|---|
| Jdb Trust | -- | None Available | |
| Banes John D | $173,000 | Nevada Title Las Vegas | |
| E*Trade Bank | $98,735 | Servicelink | |
| Park Jae R | $338,000 | Chicago Title | |
| Santamaria Emilio R | $147,990 | United Title |
Source: Public Records
Mortgage History
| Date | Status | Borrower | Loan Amount |
|---|---|---|---|
| Previous Owner | Park Jae R | $270,400 | |
| Previous Owner | Santamaria Emilio R | $118,300 | |
| Closed | Santamaria Emilio R | $14,800 | |
| Closed | Park Jae R | $33,800 |
Source: Public Records
Tax History Compared to Growth
Tax History
| Year | Tax Paid | Tax Assessment Tax Assessment Total Assessment is a certain percentage of the fair market value that is determined by local assessors to be the total taxable value of land and additions on the property. | Land | Improvement |
|---|---|---|---|---|
| 2025 | $2,476 | $117,463 | $50,400 | $67,063 |
| 2024 | $2,404 | $117,463 | $50,400 | $67,063 |
| 2023 | $2,404 | $98,947 | $35,350 | $63,597 |
| 2022 | $2,334 | $87,166 | $29,050 | $58,116 |
| 2021 | $2,266 | $82,284 | $26,950 | $55,334 |
| 2020 | $2,197 | $81,158 | $26,250 | $54,908 |
| 2019 | $2,171 | $78,161 | $24,150 | $54,011 |
| 2018 | $2,071 | $71,365 | $19,600 | $51,765 |
| 2017 | $2,304 | $69,948 | $17,850 | $52,098 |
| 2016 | $1,939 | $66,475 | $14,350 | $52,125 |
| 2015 | $1,935 | $63,310 | $11,900 | $51,410 |
| 2014 | $1,878 | $59,279 | $7,000 | $52,279 |
Source: Public Records
Map
Nearby Homes
- 1101 Enderly Ln
- 901 Cambridge Cross Place
- 1121 Tourello Ln
- 10400 Beachwalk Place
- 523 Crimson View Place
- 1304 Alderton Ln
- 601 Summer Mesa Dr
- 425 Blush Creek Place
- 916 Autumn Royal Ln
- 1401 Red Crest Ln Unit 201
- 536 Pima Canyon Ct
- 10309 Falls Church Ave
- 10001 Crimson Palisades Place Unit 103
- 1500 Cardinal Peak Ln Unit 201
- 10224 Anoka Ave
- 412 Summer Mesa Dr
- 10109 Jacob Place Unit 203
- 407 Red Canvas Place
- 10152 Kearney Hill Place
- 1511 Cardinal Peak Ln Unit 201
- 1008 Corsica Ln
- 1000 Corsica Ln
- 929 Siena Hills Ln
- 1001 Siena Hills Ln
- 1001 Siena Hills Ln
- 1001 Siena Hills Ln
- 1012 Corsica Ln
- 920 Corsica Ln
- 1009 Corsica Ln
- 921 Siena Hills Ln
- 1001 Corsica Ln
- 1013 Corsica Ln
- 1013 Corsica Ln Unit n/a
- 916 Corsica Ln
- 1016 Corsica Ln
- 917 Siena Hills Ln
- 1017 Corsica Ln
- 1009 Siena Hills Ln
- 917 Corsica Ln
- 928 Siena Hills Ln