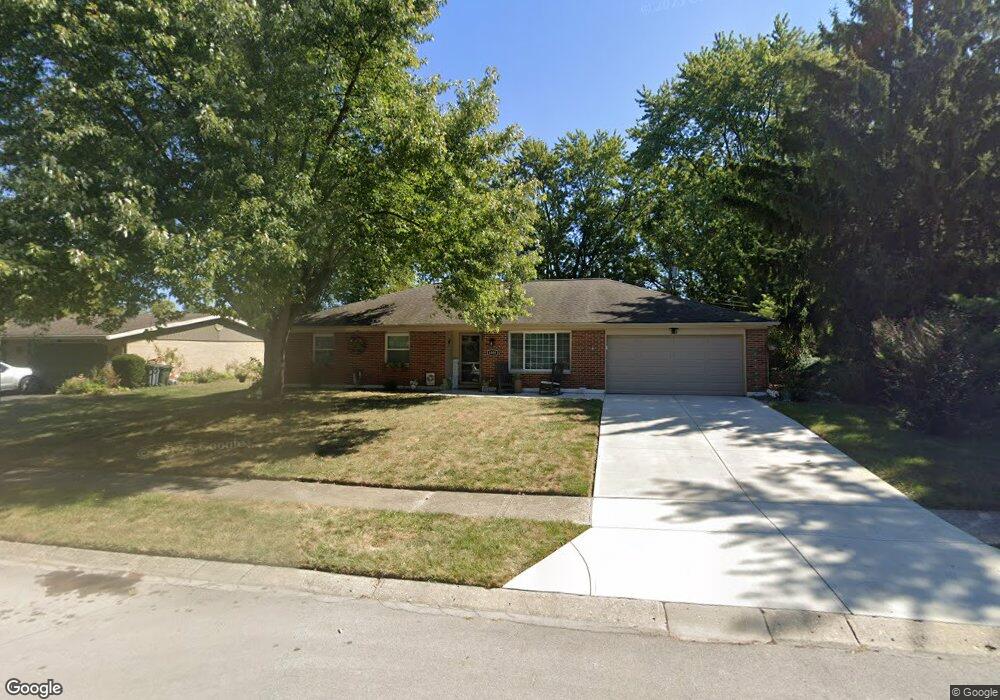
1004 Derringer Dr Englewood, OH 45322
Estimated Value: $221,000 - $246,000
4
Beds
2
Baths
1,756
Sq Ft
$134/Sq Ft
Est. Value
About This Home
This home is located at 1004 Derringer Dr, Englewood, OH 45322 and is currently estimated at $236,060, approximately $134 per square foot. 1004 Derringer Dr is a home located in Montgomery County with nearby schools including Englewood Hills Elementary School, Northmont High School, and Trotwood Preparatory & Fitness Academy.
Ownership History
Date
Name
Owned For
Owner Type
Purchase Details
Closed on
Nov 21, 2016
Sold by
Crossman Amber and Sheridan Amber
Bought by
Smith Heather and Enis Corrie
Current Estimated Value
Home Financials for this Owner
Home Financials are based on the most recent Mortgage that was taken out on this home.
Original Mortgage
$117,727
Outstanding Balance
$95,485
Interest Rate
3.75%
Mortgage Type
FHA
Estimated Equity
$140,575
Purchase Details
Closed on
Sep 15, 2008
Sold by
Denny Roy R and Gardner Denny Beverly Ann
Bought by
Crossman Amber
Home Financials for this Owner
Home Financials are based on the most recent Mortgage that was taken out on this home.
Original Mortgage
$121,990
Interest Rate
6.55%
Mortgage Type
FHA
Purchase Details
Closed on
Aug 19, 1998
Sold by
June Samuel Robert J G
Bought by
Denny Roy R and Gardner Denny Beverly Ann
Home Financials for this Owner
Home Financials are based on the most recent Mortgage that was taken out on this home.
Original Mortgage
$97,597
Interest Rate
7.03%
Mortgage Type
FHA
Create a Home Valuation Report for This Property
The Home Valuation Report is an in-depth analysis detailing your home's value as well as a comparison with similar homes in the area
Home Values in the Area
Average Home Value in this Area
Purchase History
| Date | Buyer | Sale Price | Title Company |
|---|---|---|---|
| Smith Heather | $119,900 | Chicago Title Company Llc | |
| Crossman Amber | $123,600 | Attorney | |
| Denny Roy R | $97,900 | -- | |
| Denny Roy R | $97,900 | -- |
Source: Public Records
Mortgage History
| Date | Status | Borrower | Loan Amount |
|---|---|---|---|
| Open | Smith Heather | $117,727 | |
| Previous Owner | Crossman Amber | $121,990 | |
| Previous Owner | Denny Roy R | $97,597 |
Source: Public Records
Tax History Compared to Growth
Tax History
| Year | Tax Paid | Tax Assessment Tax Assessment Total Assessment is a certain percentage of the fair market value that is determined by local assessors to be the total taxable value of land and additions on the property. | Land | Improvement |
|---|---|---|---|---|
| 2024 | $3,715 | $65,170 | $9,790 | $55,380 |
| 2023 | $3,715 | $65,170 | $9,790 | $55,380 |
| 2022 | $3,395 | $45,830 | $6,900 | $38,930 |
| 2021 | $3,405 | $45,830 | $6,900 | $38,930 |
| 2020 | $3,341 | $45,830 | $6,900 | $38,930 |
| 2019 | $2,946 | $36,200 | $7,930 | $28,270 |
| 2018 | $2,893 | $36,200 | $7,930 | $28,270 |
| 2017 | $2,873 | $36,200 | $7,930 | $28,270 |
| 2016 | $2,793 | $34,570 | $6,900 | $27,670 |
| 2015 | $2,553 | $34,570 | $6,900 | $27,670 |
| 2014 | $2,553 | $34,570 | $6,900 | $27,670 |
| 2012 | -- | $37,150 | $7,660 | $29,490 |
Source: Public Records
Map
Nearby Homes
- 1010 Heathwood Dr
- 1017 Terracewood Dr
- 1008 Merrywood Dr
- 717 Woodlawn Ave
- 510 Lambert Ln
- 718 Bonnycastle Ave
- 505 Durst Dr
- 229 Brookwood Dr
- 174 Candle Ct Unit 12
- 178 Candle Ct Unit 14
- 117 Candle Ct Unit 740
- 510 Rohr Ln
- 803 Albert St
- 916 S Main St
- 206 Gardengrove Way
- 534 Unger Ave
- 4220 Pleasanton Rd
- 206 Lodestone Dr
- 4230 Pleasanton Rd
- 4161 Gorman Ave
- 1002 Derringer Dr
- 1006 Derringer Dr
- 1007 Halfacre Ave
- 1005 Halfacre Ave
- 1008 Derringer Dr
- 1005 Derringer Dr
- 306 Katy Ln
- 1003 Derringer Dr
- 1007 Derringer Dr
- 1009 Halfacre Ave
- 304 Katy Ln
- 1001 Derringer Dr
- 1009 Derringer Dr
- 1011 Derringer Dr
- 312 Katy Ln
- 1011 Halfacre Ave
- 1006 Hazel Ave
- 1004 Hazel Ave
- 1008 Halfacre Ave
- 1008 Hazel Ave