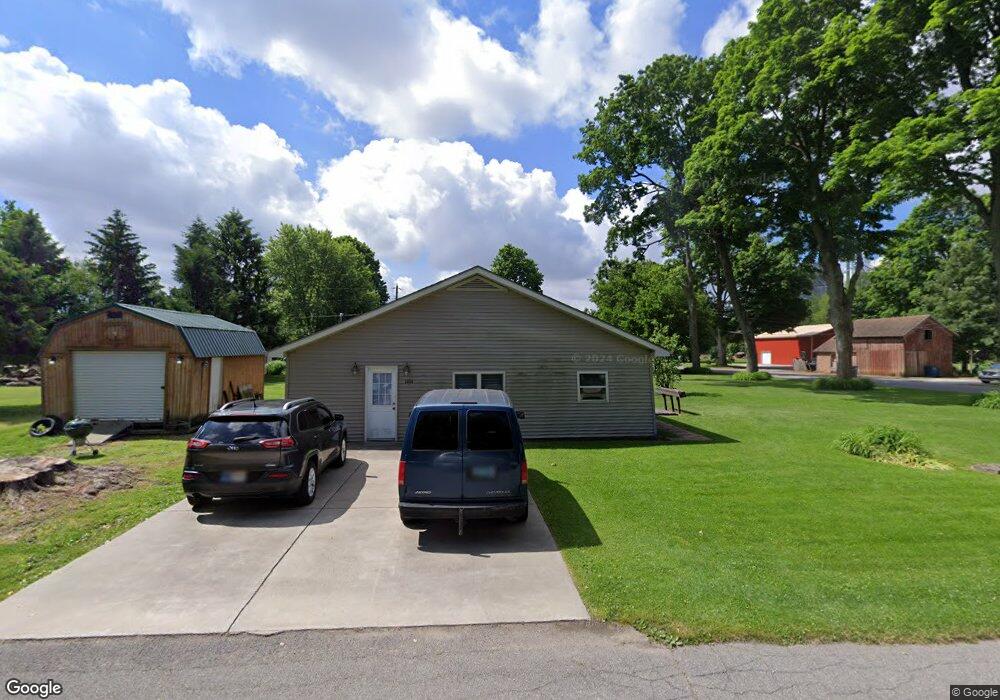
1004 E 2nd St Union Mills, IN 46382
Estimated Value: $138,330 - $222,000
3
Beds
1
Bath
1,224
Sq Ft
$157/Sq Ft
Est. Value
About This Home
This home is located at 1004 E 2nd St, Union Mills, IN 46382 and is currently estimated at $191,833, approximately $156 per square foot. 1004 E 2nd St is a home located in LaPorte County with nearby schools including South Central Elementary School and South Central Junior/Senior High School.
Ownership History
Date
Name
Owned For
Owner Type
Purchase Details
Closed on
Aug 7, 2019
Sold by
Wakeman David E and Wakeman Lori L
Bought by
Goldie Jacob A
Current Estimated Value
Home Financials for this Owner
Home Financials are based on the most recent Mortgage that was taken out on this home.
Original Mortgage
$92,000
Interest Rate
4.1%
Mortgage Type
New Conventional
Purchase Details
Closed on
Jun 14, 2019
Sold by
Claussen Daniel L and Claussen Kelly L
Bought by
Goldie Jacob A
Home Financials for this Owner
Home Financials are based on the most recent Mortgage that was taken out on this home.
Original Mortgage
$92,000
Interest Rate
4.1%
Mortgage Type
New Conventional
Purchase Details
Closed on
Mar 28, 2012
Sold by
Claussen Daniel
Bought by
Claussen Daniel L and Claussen Kelly L
Home Financials for this Owner
Home Financials are based on the most recent Mortgage that was taken out on this home.
Original Mortgage
$59,000
Interest Rate
3.95%
Mortgage Type
New Conventional
Create a Home Valuation Report for This Property
The Home Valuation Report is an in-depth analysis detailing your home's value as well as a comparison with similar homes in the area
Purchase History
| Date | Buyer | Sale Price | Title Company |
|---|---|---|---|
| Goldie Jacob A | -- | None Available | |
| Goldie Jacob A | -- | Meridian Title | |
| Claussen Daniel L | -- | Chicago Title Insurance Co |
Source: Public Records
Mortgage History
| Date | Status | Borrower | Loan Amount |
|---|---|---|---|
| Previous Owner | Goldie Jacob A | $92,000 | |
| Previous Owner | Claussen Daniel L | $59,000 |
Source: Public Records
Tax History
| Year | Tax Paid | Tax Assessment Tax Assessment Total Assessment is a certain percentage of the fair market value that is determined by local assessors to be the total taxable value of land and additions on the property. | Land | Improvement |
|---|---|---|---|---|
| 2025 | $502 | $85,200 | $28,700 | $56,500 |
| 2024 | $495 | $81,400 | $28,700 | $52,700 |
| 2023 | $416 | $78,800 | $28,700 | $50,100 |
| 2022 | $490 | $80,500 | $28,700 | $51,800 |
| 2021 | $376 | $76,300 | $28,700 | $47,600 |
| 2020 | $385 | $76,300 | $28,700 | $47,600 |
| 2019 | $422 | $64,200 | $17,500 | $46,700 |
| 2018 | $1,365 | $69,500 | $17,500 | $52,000 |
| 2017 | $1,438 | $70,900 | $17,500 | $53,400 |
| 2016 | $1,233 | $67,900 | $15,000 | $52,900 |
| 2014 | $1,158 | $64,700 | $15,000 | $49,700 |
Source: Public Records
Map
Nearby Homes
- 901 E 3rd St
- 411 E Hamilton St
- Tbd2 W 800 S
- Tbd3 W 800 S
- 5653 S 425 W
- 997 W 850 S
- 501 W 850 S
- 10707 Long Ln
- 522 Oxford Rd
- 301 Malvern Rd
- 303 Malvern Rd
- 4571 S 150 W
- 437 Fairmount Rd
- 801 Larchmere Rd
- 912 Kenilworth Rd
- 913 Larchmere Rd
- 907 Larchmere Rd
- 905 Larchmere Rd
- 903 Larchmere Rd
- 911 Larchmere Rd
Your Personal Tour Guide
Ask me questions while you tour the home.